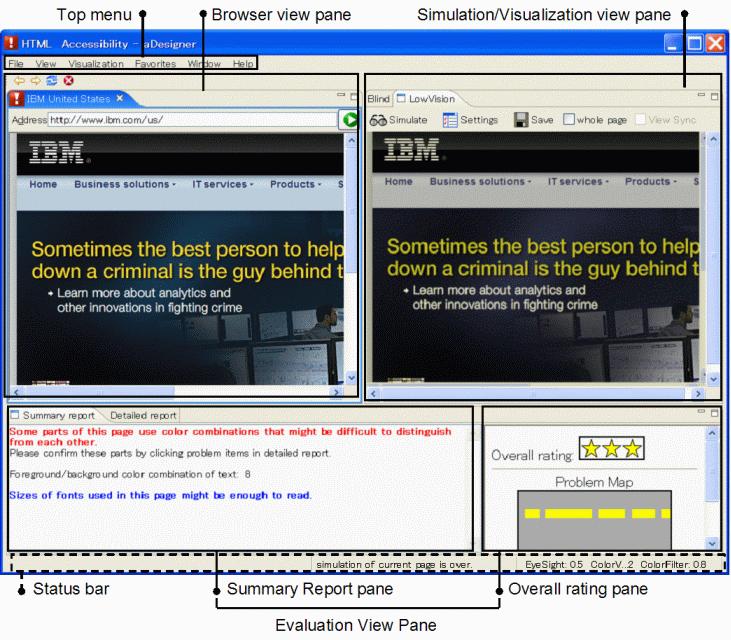
Figure 1. The user interface of aDesigner.
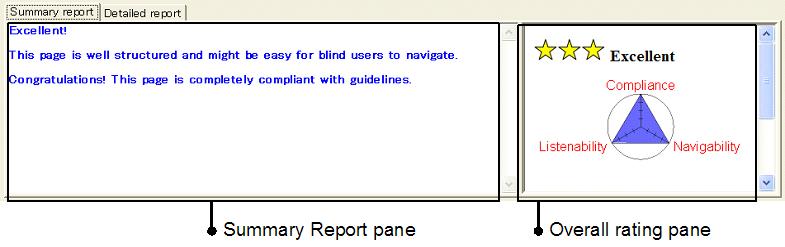
The aDesigner workspace consists of five panes (see Figure 1). Two appear at the top: the Browser View pane is on the left, and (depending on the active mode) either the Simulation View pane (low vision tab) or the Visualization View pane (blind tab) is on the right. Each pane includes function buttons. Below these panes is the Evaluation View pane. The Evaluation View pane has two kinds of tabs, the Summary Report tab and the Detailed Report tab. The Summary Report tab has the Summary Report pane and the Overall Rating pane. The Detailed Report tab has the Tree View pane and the Line View pane (which together make up the Problem List) and most aDesigner components are shared by both modes.
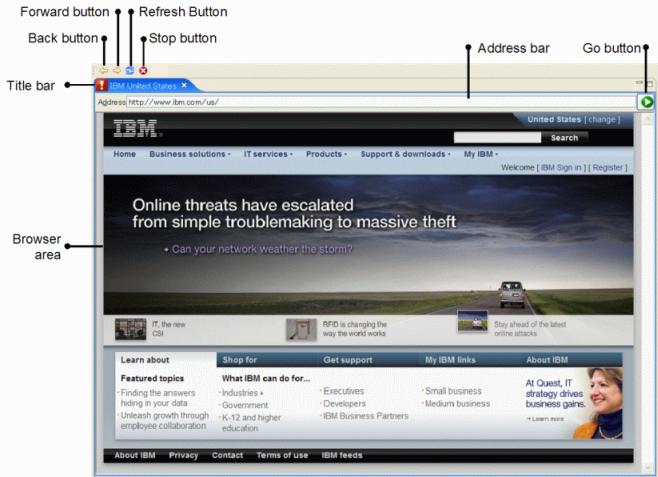
The page to be tested is opened in the Browser View pane (Figure 2). By default, this pane is at the top left of the screen. The size of the pane can be changed by dragging the edges.
At the top of the pane are the address bar, forward and backward arrow buttons, a stop button, a refresh button, and a GO button. The URL of the page to be tested is entered in the address bar and clicking GO opens the page.
To the right of the Browser View pane is a pane that changes depending on the active mode. In the low vision tab, the pane is the Simulation View pane (Figure 3). In this pane, there is a simulated view showing the experience of what a low vision reader might see when looking at the target webpage. In the blind tab, the pane is the Visualization View pane (Figure 4). In this tab, the page shows an impression of how a blind user who relies on a voice browser is going to experience the page. By default, this pane is on the top right of the screen. The size of the pane can be changed by dragging the edges.
Clicking one of the two tabs at the top of the pane select the visualization type. The buttons in the row below the Low Vision and Blind tabs are determined by the active mode.
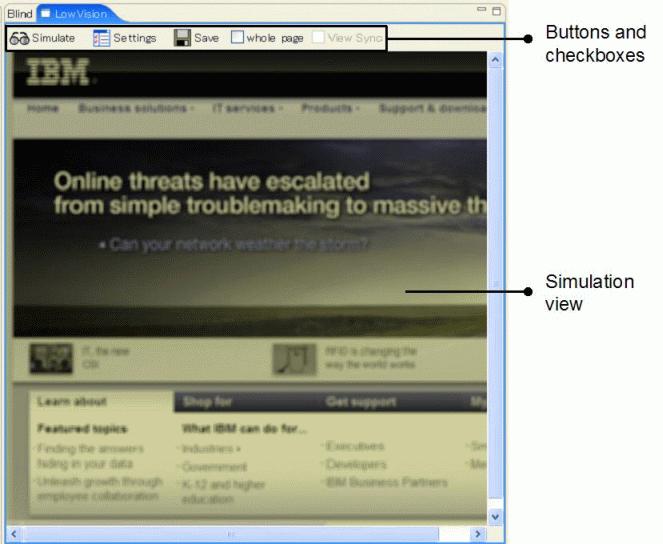
The buttons and check boxes specify the portions of the target page to be checked and the vision deficiency parameters aDesigner should use for the assessment.
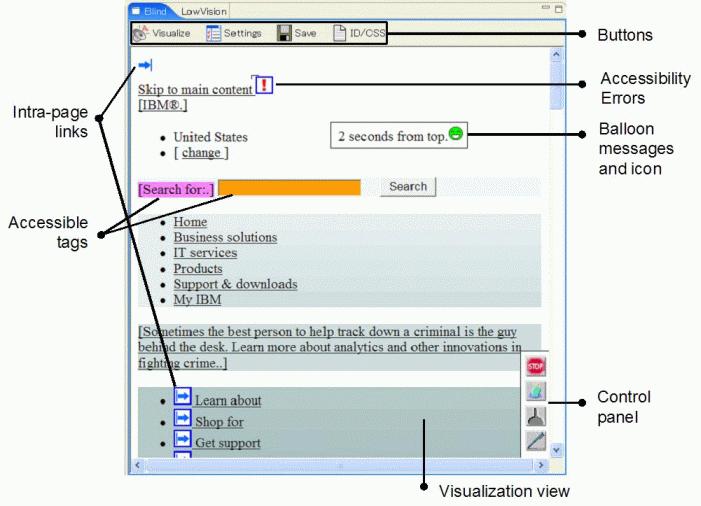
The screen capture shows the buttons that appear in this pane and the items that aDesigner checks when it is running in the blind mode, such as reaching time, tags that can easily be accessed by voice browsers, and the availability of intra-page links.
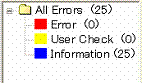
The Overall Rating pane area provides the target page's overall rating for accessibility and usability (Figure 7).
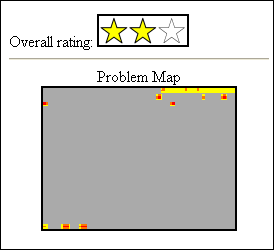
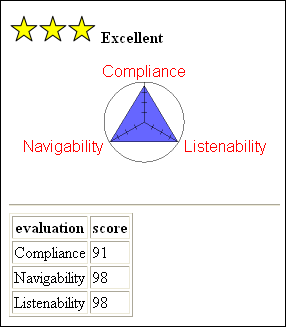
In the low vision mode, the pane provides an overall rating that is based on the total severity values of the problems and a problem map that indicates the positions of the problems. In the blind mode, the pane provides an overall page rating that is based on the number of the problems and a radar chart that visually shows the target page's rating in terms of compliance, navigability, and listenability. The compliance rating is based on the number of problems concerned with compliance. The navigability rating reflects how well structured the Web content is by using headings, intra-page links, labels, and so on. The listenability rating denotes how appropriate the alternative texts are.
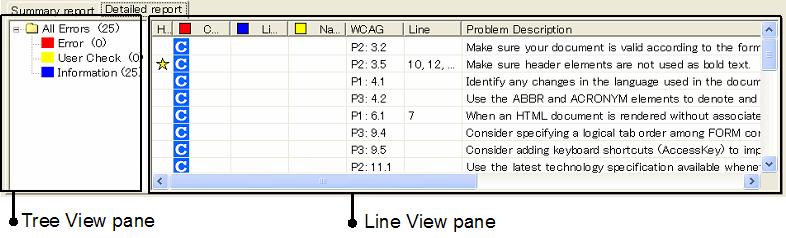
When accessibility problems are detected, they appear in the Problem List. The list consists of two parts: the Tree View pane and the Line View pane.
The Tree View (Figure 8) categorizes the problems. The category of problems to be listed in the Line View can be selected by clicking the category name.
The line view presents the problems for the selected categories line by line. Figure 9 shows a sample of the Line View pane (blind).
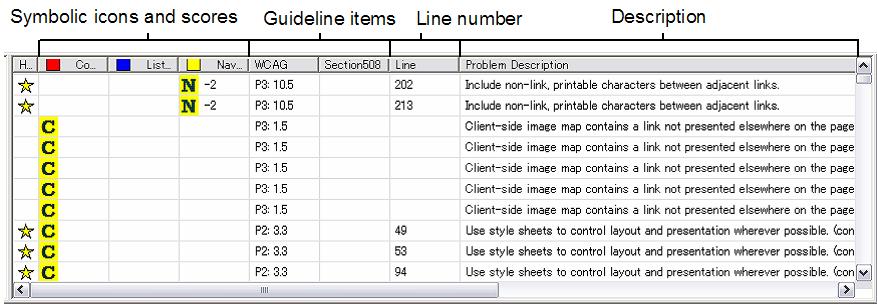
In the blind mode, each line provides the following information about a problem:
The Line View pane (low vision) differs slightly from that of the blind mode (Figure 9).
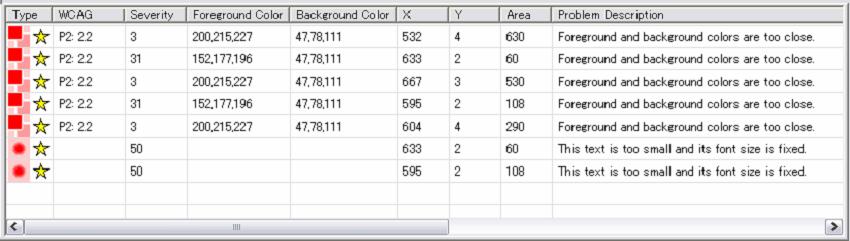
In the low vision mode, each line provides the following information about a problem:
Left-click a line in this view to highlight the element that corresponds to the problem in the Simulation/Visualization view.
Right-click a line or press Shift+F10 to open a context menu. The items in the context menu are as follows:
The status bar shows information related to the active mode.