| Release | Resolved | Community Contributions |
| 2.0 26 Jun 2013 |
105 bugs | Major release containing LTTng restructuring, further overhaul of the profiling framework, SystemTap restructuring, and streamlining the UI in many places in addition to bug fixes. |
New in Linux Tools 2.0
Profiling Framework
|
Profiling Tools Menu |
The Profiling Framework has been modified to move all of the profiling tools from the Profile As.. context menu into a separate "Profiling Tools" context menu. For more details, see the Profiling User's Guide. 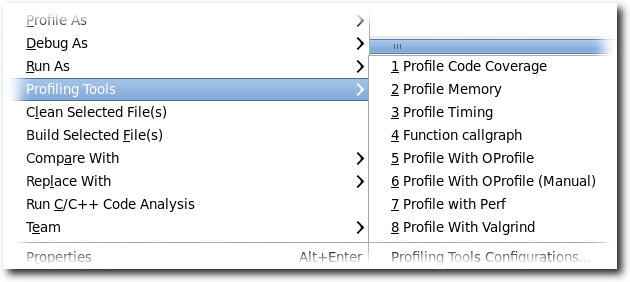
|
|
|
|
|
Local C/C++ Application |
Support has been added to the profiling framework foto supply "Profile As...->Local C/C++ Application". This launch short-cut shares the launch configuration settings for Run and Debug (Local C/C++ Application). What this means is that if the user sets up a Run configuration for a Local C/C++ Application and for example, sets up program arguments or environment variables, these settings will be used in profiling as well and do not require reentering. An additional tab will appear in the Profile Configurations dialog to allow setting the profiling tool (any of the Linux Tools profiling tools) as well as the profiling tool options. For more details, see the Profiling User's Guide. 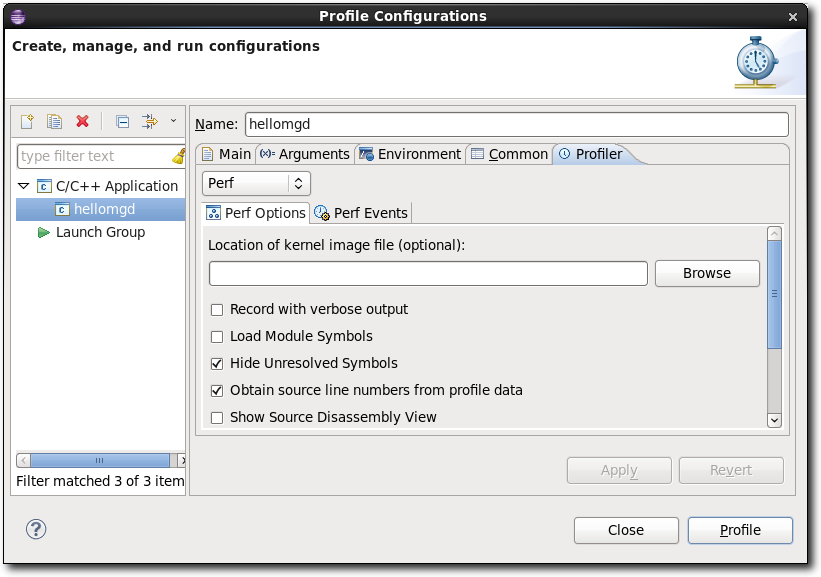
|
|
|
|
Linux Tracing Toolkit
|
Short Description |
Many enhancemants and improvements have been made to
the LTTng integration in Eclipse as well as to the Tracing and
Monitoring Framework (TMF). Also, a new GDB Tracepoint Analysis
feature based on TMF is included in this release.
Note: The support for the legacy LTTng tracer (v0.x) is removed. |
|
|
|
|
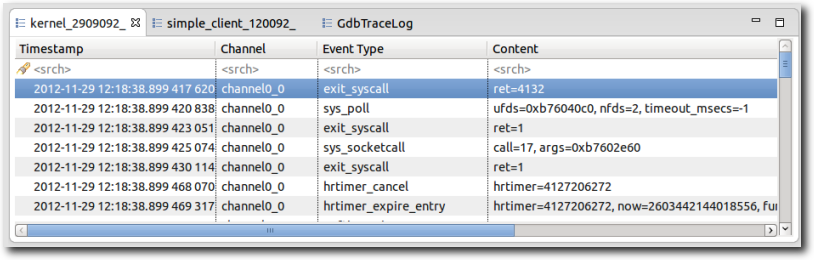
Support for Multiple Simultaneously Open Traces |
With the support of Events editors as replacement
to the Events view it is now possible to open multiple traces
simultaneously at the same time. The Events editor shows the
basic trace data elements (events) in a tabular format. The editors
can be dragged in the editor area so that several traces may be
shown side by side. These traces are synchronized by timestamp.
Other open tracing views reflect the trace in focus.
|
|
|
|
|
Support for Link With Editor |
The tracing project now supports the feature
Link With Editor of the Project Explorer view. With this
feature it is now possible to
Refer to the User Guide for detailed information on this feature and its usage. 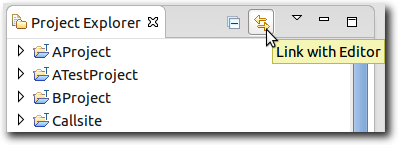
|
|
|
|
|
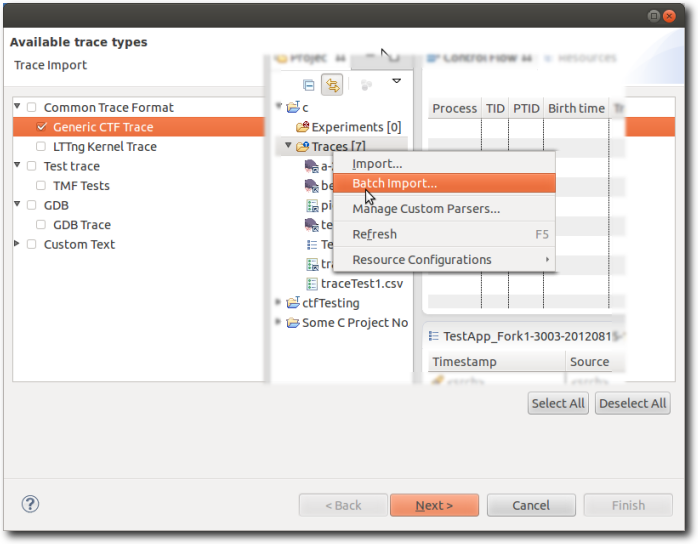
New Batch Trace Import Wizard |
The Batch Import Trace Wizard allows users
to search their media for traces and import multiple traces of
varying types simultaneously. It also handles name clashes and
renaming of traces.
|
|
|
|
|
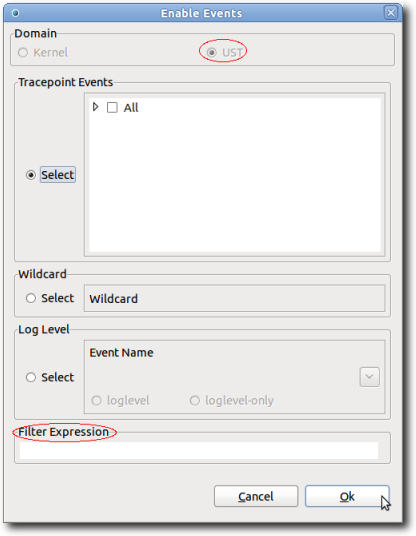
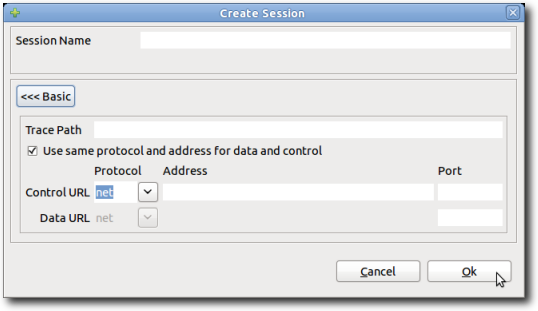
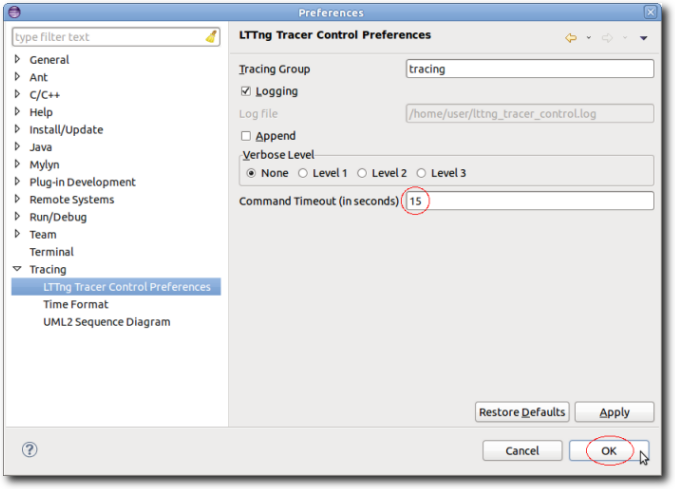
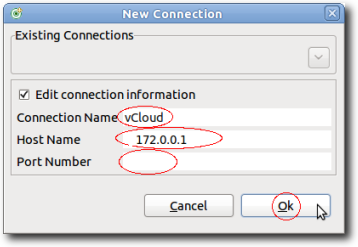
LTTng Tracer Control Improvements |
|
|
|
|
|
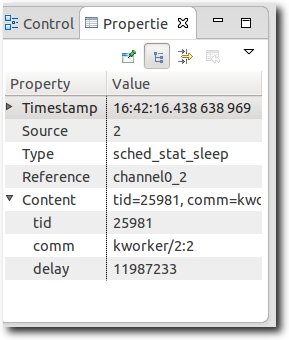
Event Details in Properties View |
The Properties view now display the event details
when selecting an event in the table of the Events editor.
|
|
|
|
|
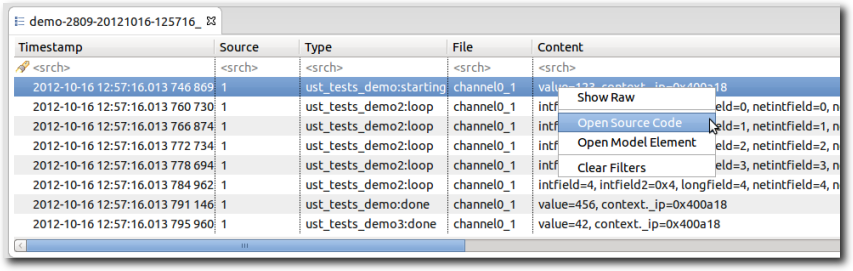
Support for Source and Model Lookup |
For CTF traces using specification v1.8.2 or above, information can optionally be embedded in the trace to indicate the source of a trace event. This is accessed through the event context menu by right clicking on an event in the table.
|
|
|
|
|
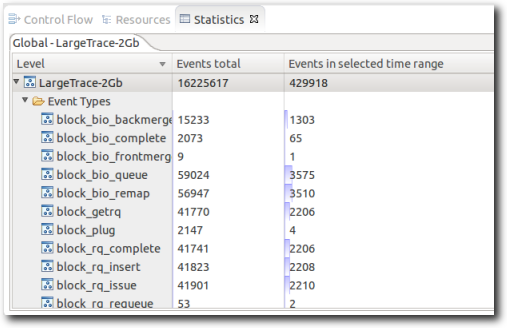
Statistics View Improvements |
|
|
|
|
|
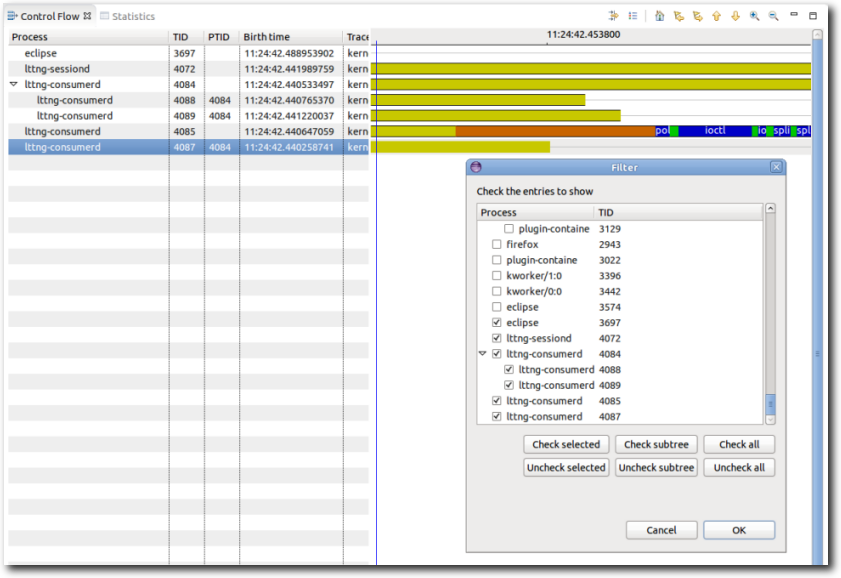
Support of Filters In Control Flow View |
The Control Flow view has been enhanced to allow
for configuration of process filters. With this addition it is
possible to configure the set of processes to be displayed.
|
|
|
|
|
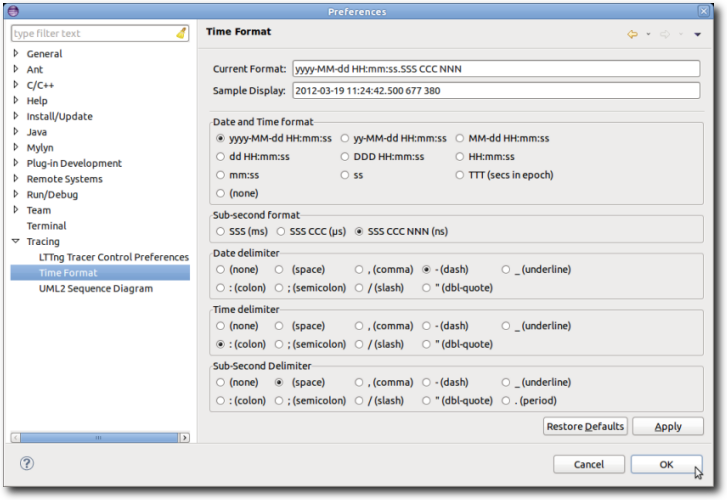
Timestamp Format Preferences |
A new tracing preference page has been added to
configure the format of the time stamp to be displayed.
|
|
|
|
|
Trace Indexing Progress and Speed |
The status bar of Eclipse and the Progess view are now showing the current number of events being parsed during the execution of the indexing job. Moreover, the Progress view is showing the current number of events per seconds during indexing. 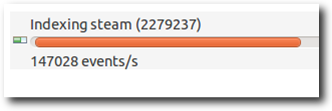
|
|
|
|
|
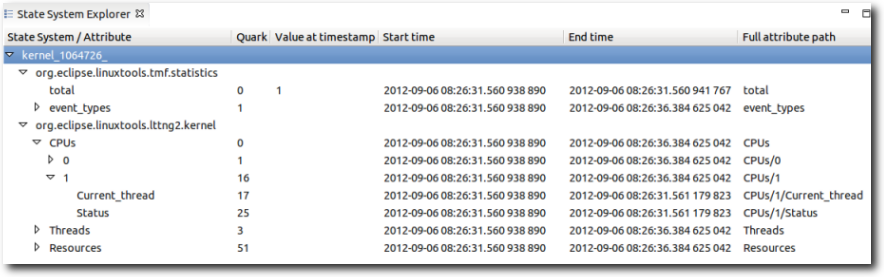
State System Explorer View |
The State System Explorer view allows the user to
inspect the state interval values of every attribute of a state
system at a particular time.
|
|
|
|
|
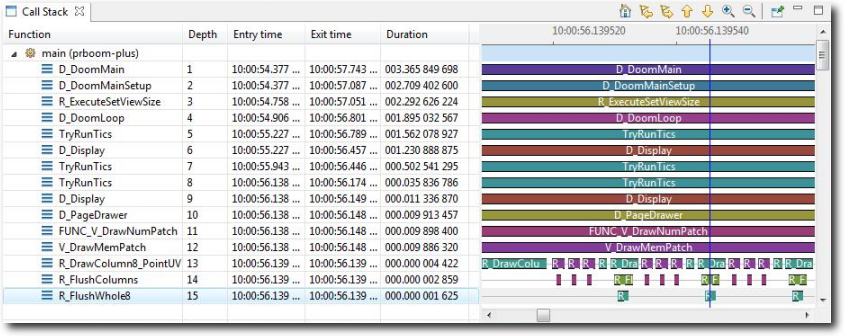
Generic Call Stack View |
The Call Stack view allows the user to visualize
the call stack per thread over time, if the application and trace
provide this information. The view shows the call stack information
for the currently selected trace.
|
|
|
|
|
Miscellaneous Improvements |
|
|
|
|
|
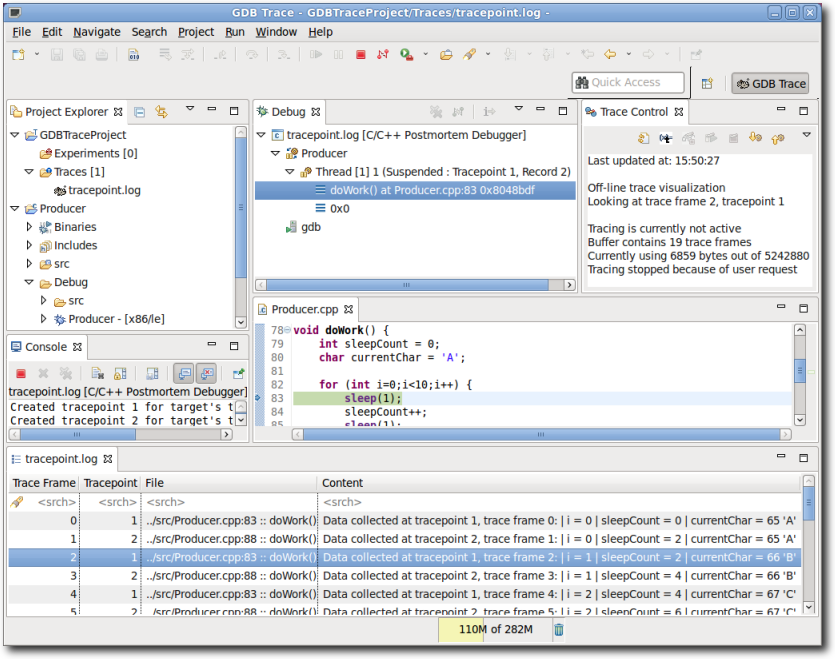
New GDB Tracepoint Analysis Feature |
The GDB Tracepoint Analysis feature is an extension
to the Tracing and Monitoring Framework (TMF) that allows the
visualization and analysis of C/C++ tracepoint data collected by
GDB and stored to a log file. It can be installed separately from
the LTTng features from the Linux Tools update site.
|
|
|
|
 has been introduced for traces that don't have a trace type
associated with.
has been introduced for traces that don't have a trace type
associated with.Perf Integration
|
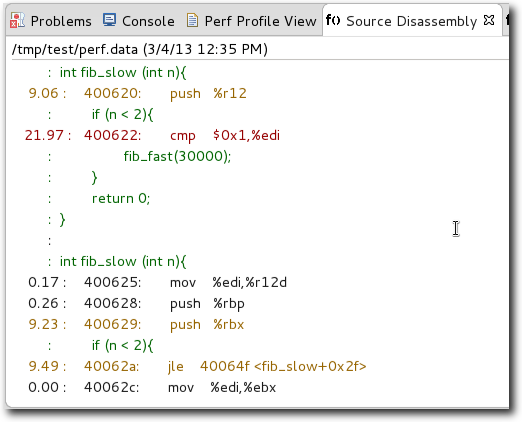
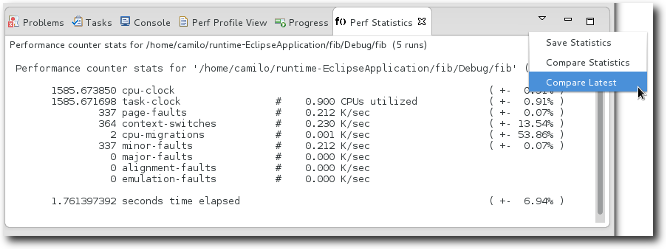
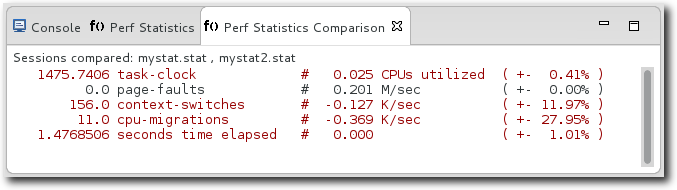
New Features Supported |
Various existing features of the underlying Perf tool have been integrated with the plug-in. These include support for displaying performance statistics reports, source disassembly viewer for instruction level analysis and comparison between statistics or profile reports.
|
|
|
|

SystemTap Integration
|
SystemTap Launch Configuration |
Systemtap launch configuration has been enhanced to allow SystemTap options to be specified for the script. Options include being able to specify running an executable for the script and using dyninst. 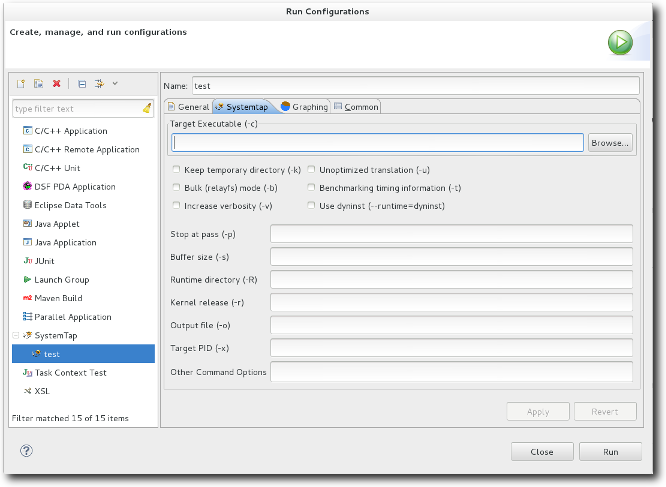
|
|
|
|
|
Graphing SystemTap Output |
Graphing capabilities which were formerly in a special perspective have been moved as an option of a SystemTap launch configuration. A user can set up regex to parse the SystemTap output and then map that to a graph such as a Bar Graph, Line Graph, Pie Graph, or additional choices. 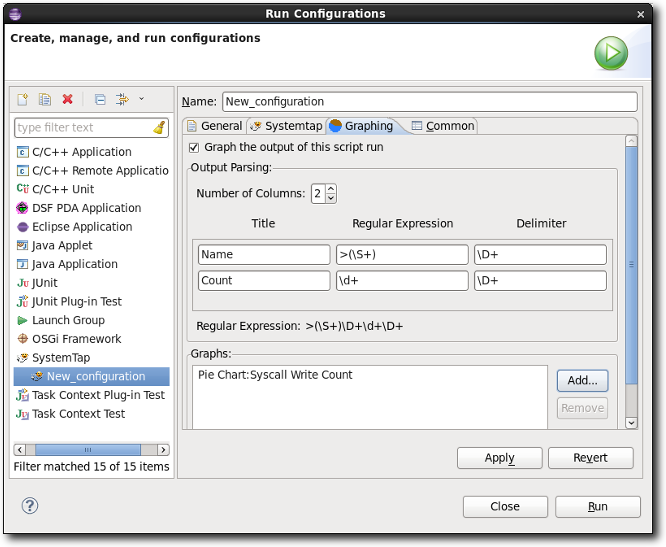
|
|
|
|
|
SystemTap Editor Improvements |
The SystemTap editor has been improved to extract documentation from man pages and uses this to support hover help and completion in the SystemTap editor for probes, functions, and some variables that are documented. 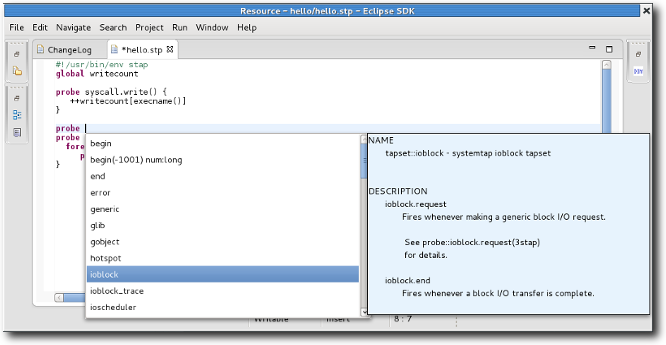
|
|
|
|