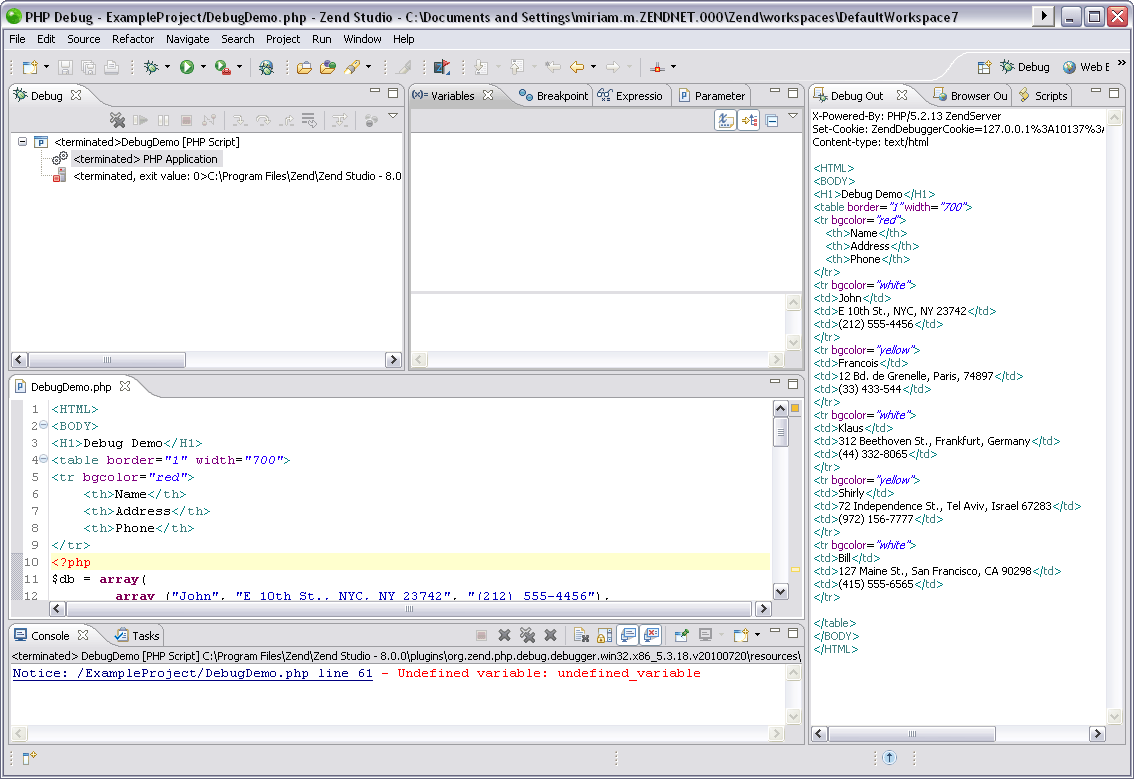
The PHP Debug Perspective can be launched automatically when a Debug session is run. It contains views which allow you to control and monitor the debugging process.

The PHP Debug Perspective contains the following views:
Debug View - Here you can control (stop, pause, and resume) the debugging process. You can also decide whether to step into, step over or step return (step out of) certain functions.
Variables View - Displays the various variables in your script.
Breakpoints View - Displays the breakpoints you have entered.
Parameter Stack View - Displays the parameters through which functions are reached.
Debug Output View - Displays the textual output of the script. This will be updated as the debugging process continues.
Browser Output View - Displays the output of the script to a browser. This will be updated as the debugging process continues.
Expressions View - Displays the progress of selected variables. The view will only be displayed if you have selected to watch a variable.
Scripts View - Displays a list of available scripts.
Editor - Displays the code at the relevant sections, according to which line is selected in the Debug View window.
Console View - Displays any error and warning messages.
Tasks View - Displays tasks that were added to your script (if applicable).
Note:
By default, a dialog will appear asking whether you want to open the Debug Perspective when a debugging session is run. To change this behavior, open the Perspectives Preferences dialog by going to Window | Preferences | Run/Debug | Perspectives and select Always, Never or Prompt in the 'Open the associated perspective when launching' category.
|
|
|
Related Links: |
|
|