TRACE Critical-path analysis
NOTE: Analysis is applied to the current filtered view
Critical path analysis (CPA) is a technique to find bottleneck activities and resources. The technique implemented in the TRACE tool constructs a constraint graph from the claims in the trace. A constraint graph is a weighted directed graph in which the weights on the edges encode timing constraints. For instance, if we have two claims, c1 and c2, and an edge from the end of c1 to the start of c2 with weight w, then this means that c2 always starts at least w time units after c1 ends. An edge from the start of c2 to the end of c1 with weight -w means that c2 always starts at most w time units after c1 ends. These weights can thus be used to specify lower and upper bounds on the time duration between the start and end of claims.
Note that there may be cycles in the graph, but these must have a negative weight. A cycle with a positive weight indicates inconsistent constraints. Critical-path analysis computes the longest paths through the constraint graph. The claims on the longest paths are critical and their improvement (execution time) can improve the performance of the system.
Critical-path analysis is available when a single trace is viewed through the
![]() menu. The parameters for the analysis are the following:
menu. The parameters for the analysis are the following:
-
Use of specified dependencies :
- The Full option means that the edges in the constraint graph come from the dependencies of the trace, using weight 0, which means that the a dependency does not give a quantitative constraint, but rather an order constraint. Two constraints also are added between the start and end of each claim that expresses that the claim takes exactly the specified time.
- The None options means that no dependencies from the trace are used for constraints. Instead the ε heuristic is used to create constraints. This heuristic adds a constraint with weight 0 between the end of a claim c1 and the start of another claim c2 if and only if c2 starts within ε time units after c1 ends. Furthermore, the intra-claim dependencies as described above are added. The ε parameter is defined by the user (see below).
- Last, the As application dependencies option means that the ε heuristic is used again to create the constraint graph. If a critical edge in the constraint graph does not conform to a dependency, then this indicates that blocking on non-application aspects occurs. An example is an activity that must wait for resources to become available.
- Use default ε : The default allowable gap between claims in order to relate them in the graph representation equals 0. This usually is a proper value for traces that have been produced by simulation models, as the timing in such models is perfect in some sense. Traces that have been produced by real systems typically have timing overhead between claims. The ε parameter should be as least as large as the maximum gap. Of course, this is very difficult to determine.
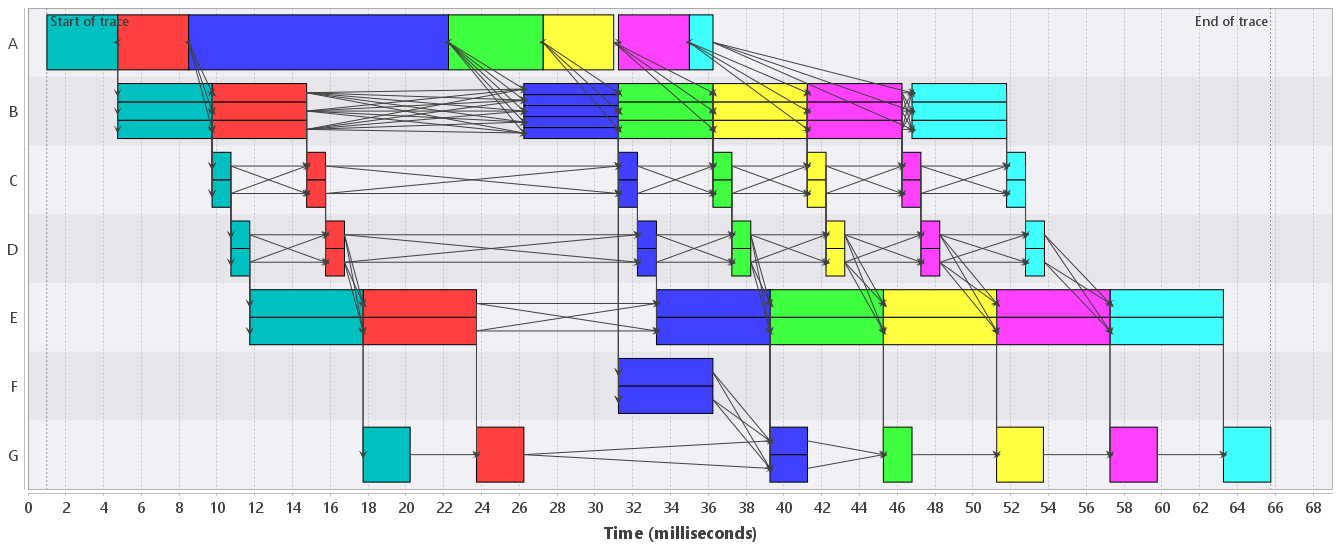
Consider the trace shown in Figure 1, which has claims and dependencies between claims. It is a view on the the trace "model-bf.etf" from the running example. We have filtered out all but the memory resources M1 and M2, and also restricted the id attribute to values 0 to 5. Note that the dependencies are the data dependencies between processing tasks of the ODSE system. During the execution of these tasks (which resulted in this trace), however, there are probably more dependencies because of limited memory.

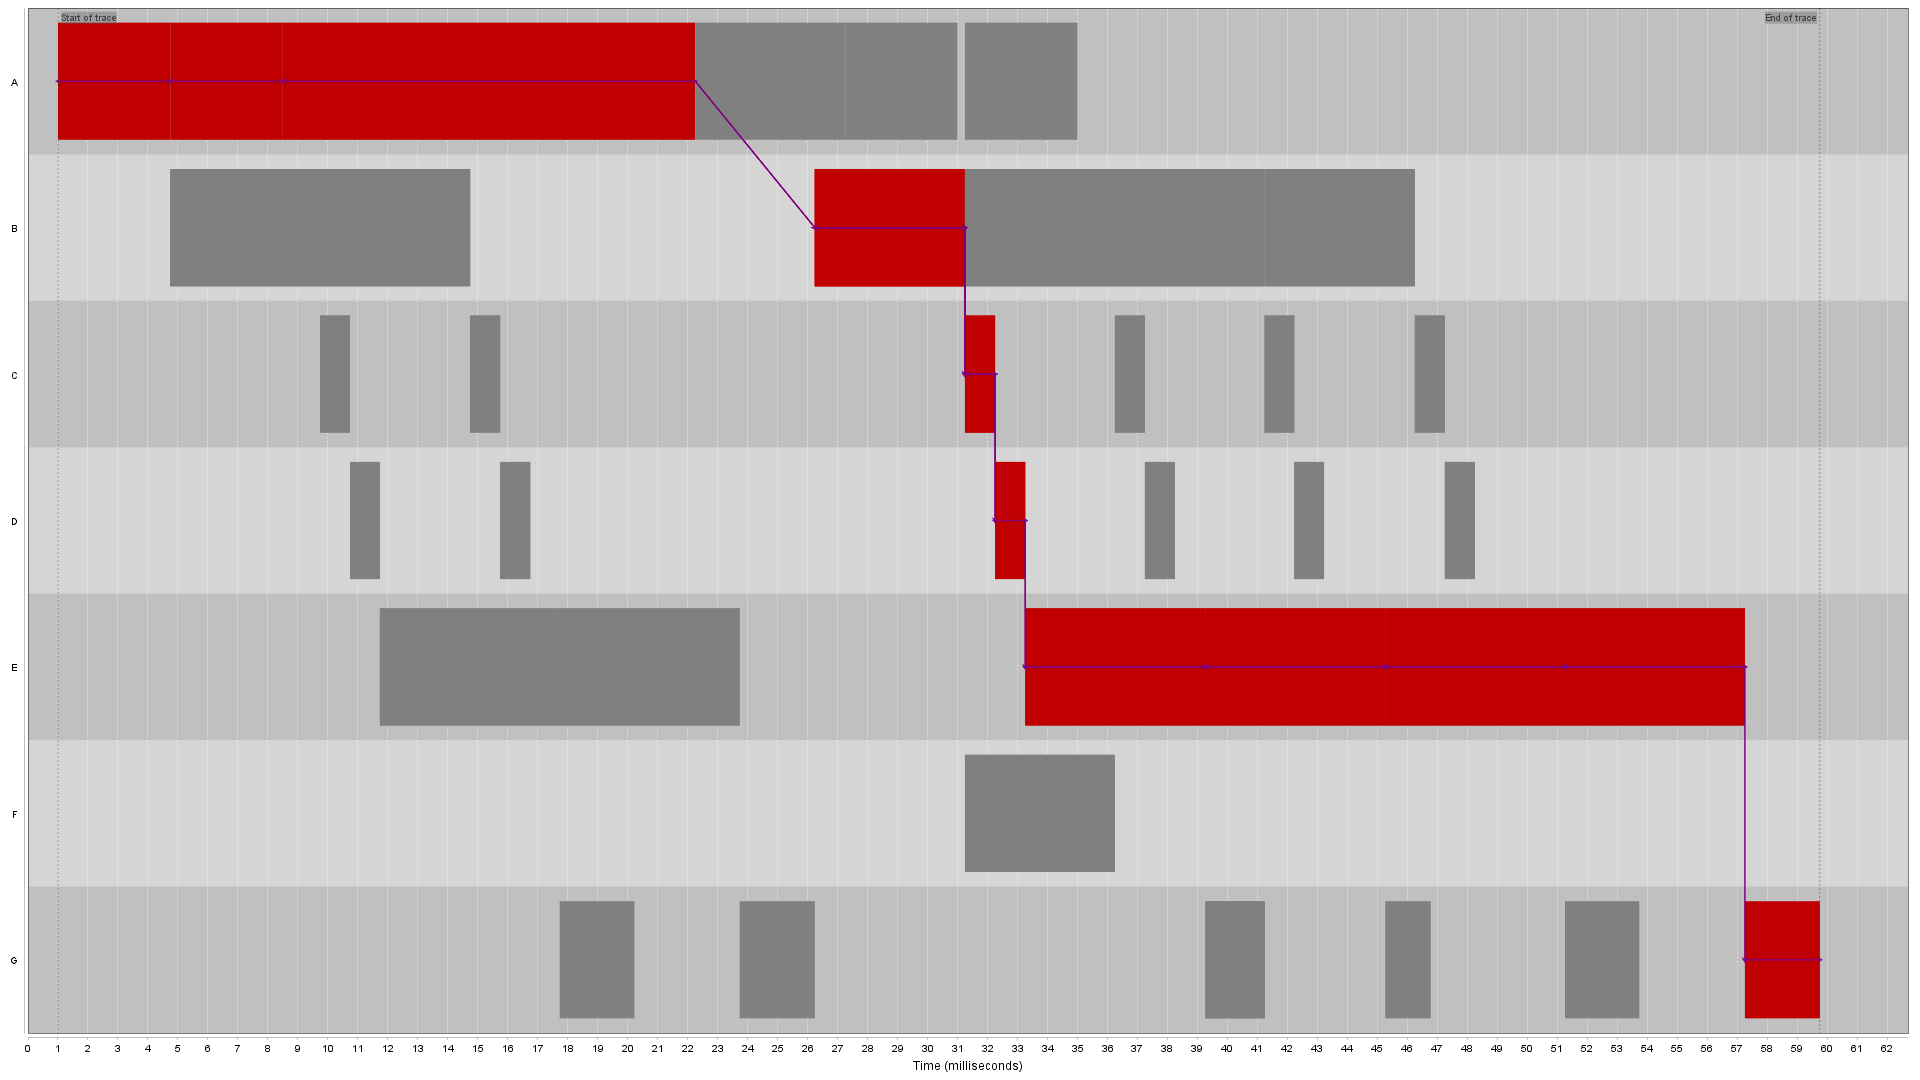
Figure 2 shows the activity view after CPA with Full usage of the dependencies. The critical tasks are marked with a red color, and the critical dependencies are added to the trace. A filter is applied to only show these critical dependencies. Note that the critical tasks are consecutive except for the those at the top in in the middle of the figure. This gap indicates that this is not the true critical path as the red task in the second section (named B) is apparantly waiting for something else than the end of the red task in first section (named A).

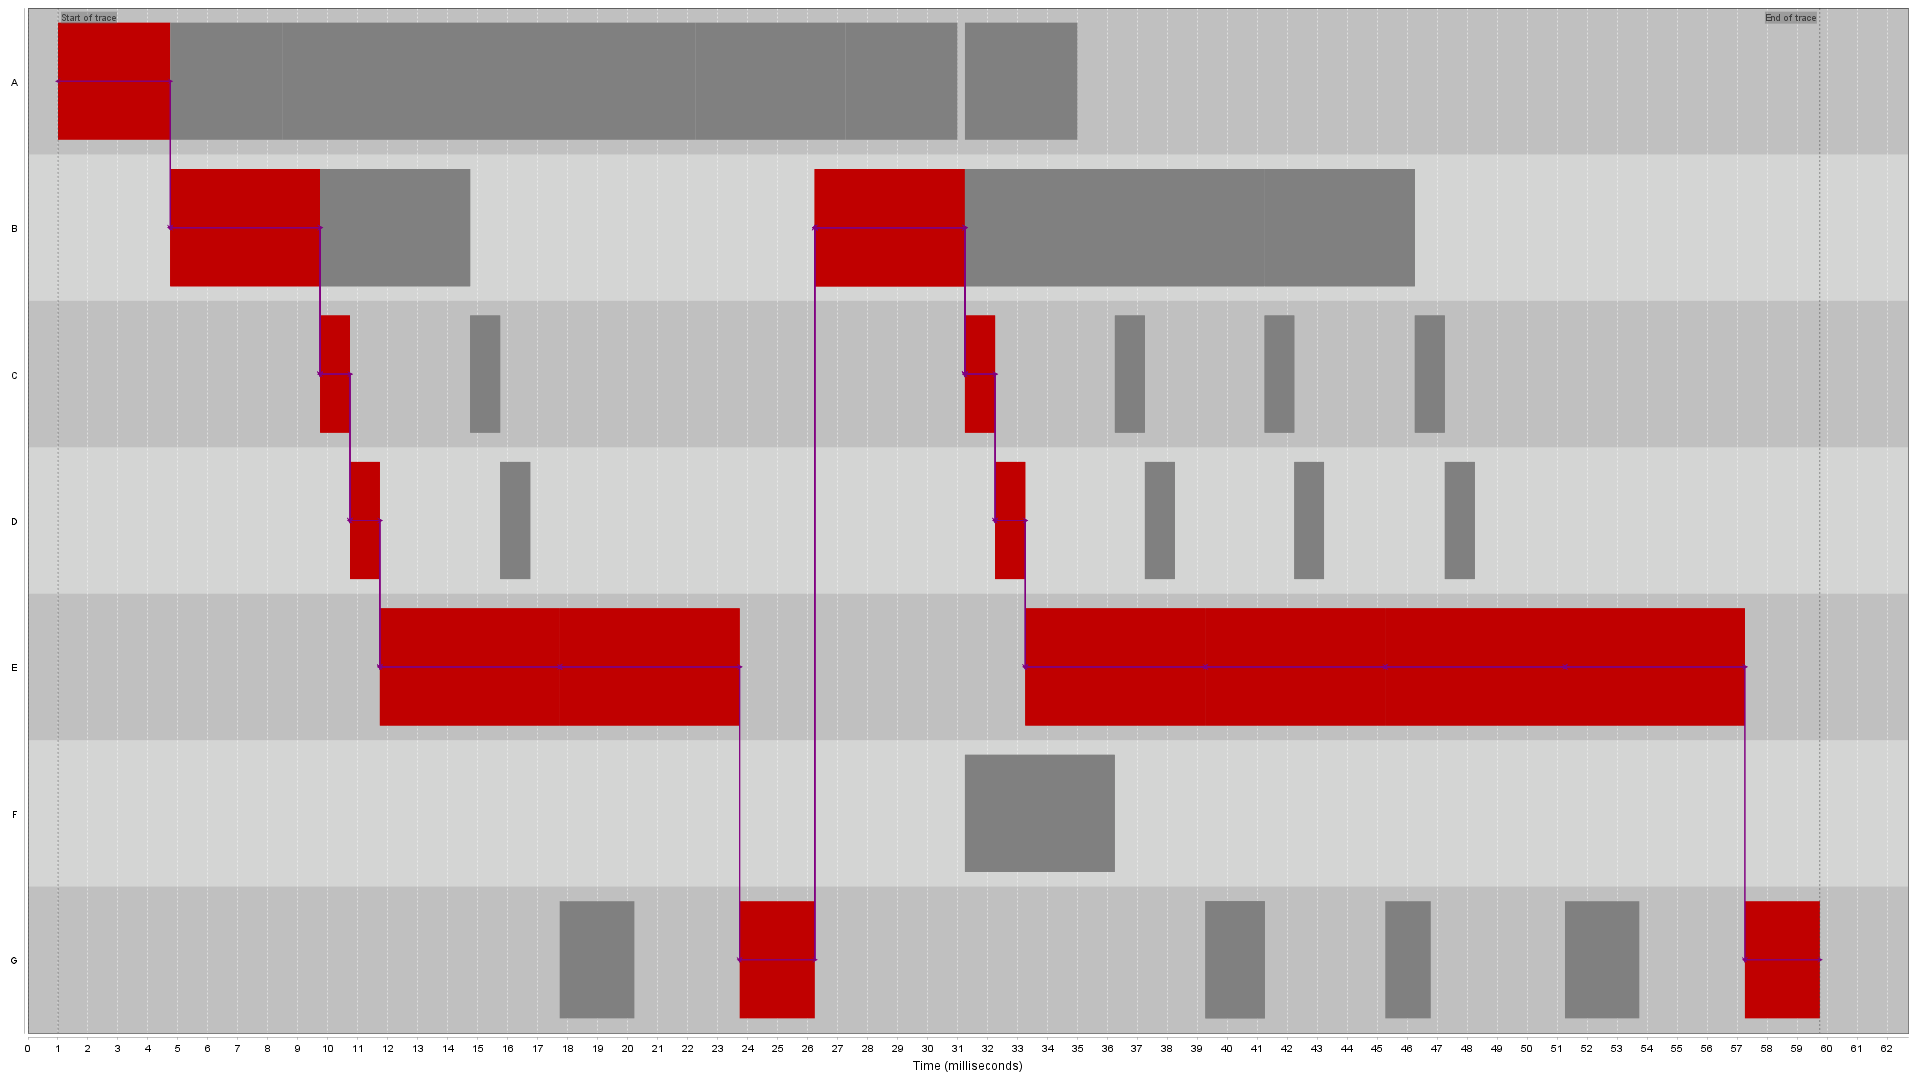
Figure 3 shows the activity view after CPA with None usage of the dependencies. The critical tasks are marked with a dull red color, and the critical dependencies are added to the trace. Again, a filter is applied to only show these critical dependencies. Note that the critical tasks are consecutive now due to the ε heuristic with ε = 0. The critical path shows that the B task is waiting for a G task to finish (G releases memory which B needs).

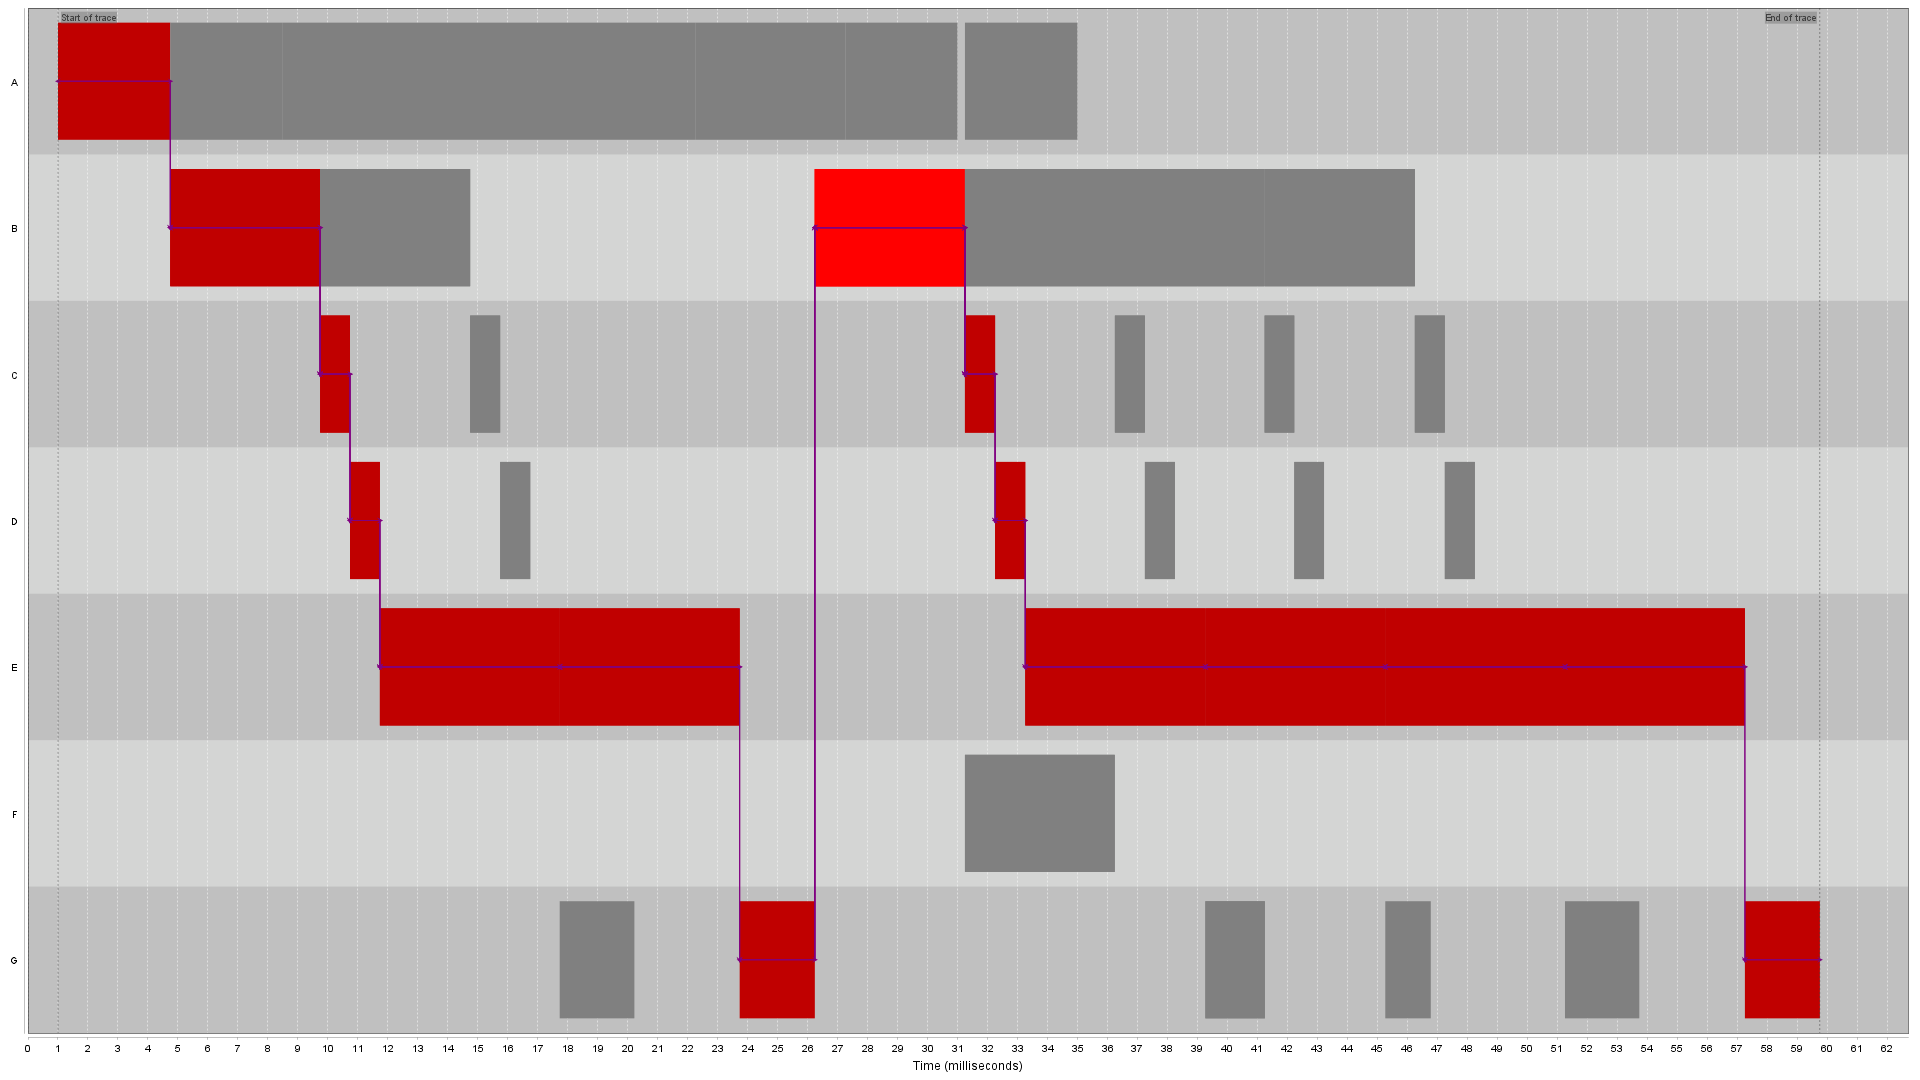
Finally, figure 4 shows the activity view after CPA with use of the dependencies As application dependencies. The critical tasks are marked with a dull red color, and the critical dependencies are added to the trace. Again, a filter is applied to only show these critical dependencies. Note that the critical task B that was blocked because it had to wait for memory to be released by G now is marked bright red. This indicates that task B is not blocked on an application dependency, which can indicate resource contention.
