TRACE Distance analysis
NOTE: Analysis is applied to the current filtered view
Distance analysis is useful for comparing traces and finding the structural differences between traces that are almost identical. A typical use case is to compare a model trace with a system trace for model calibration or system validation.
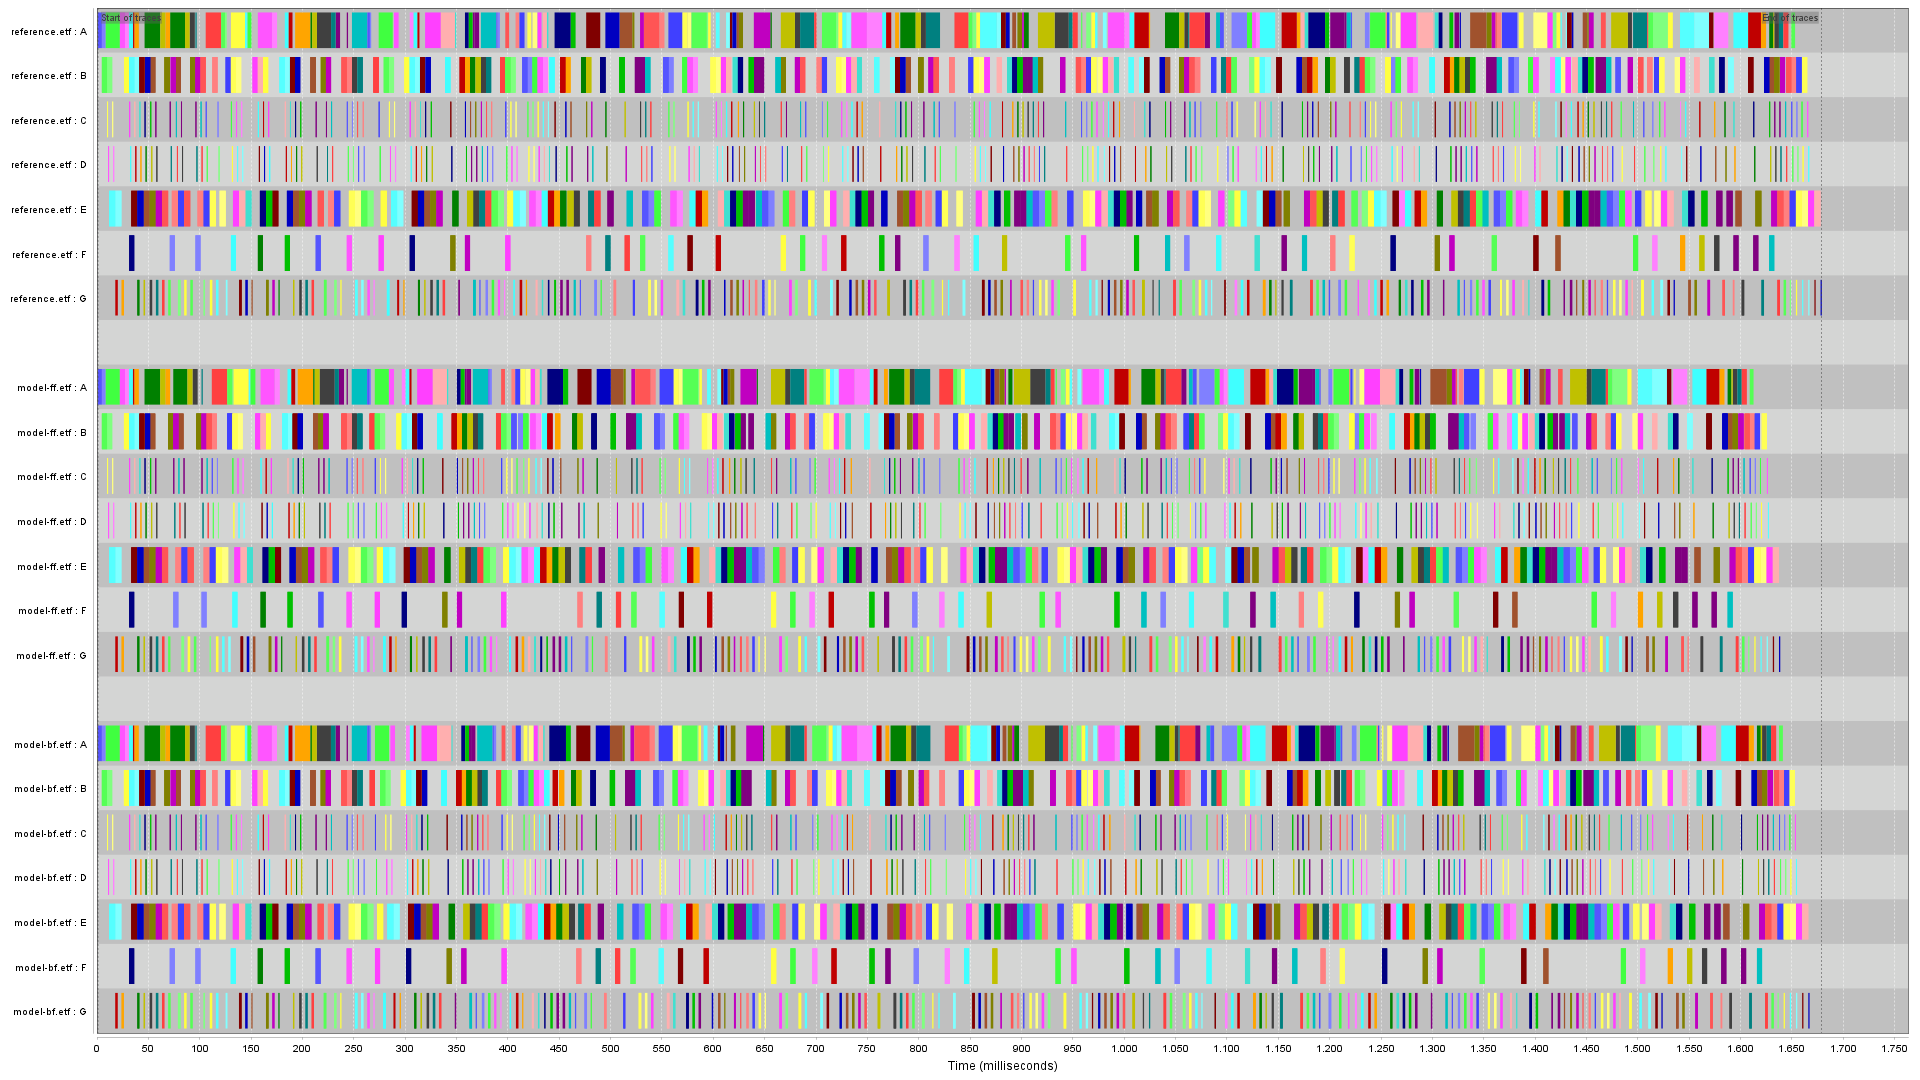
Distance analysis computes a pseudo metric on traces and highlights differences with respect to absence or presence and ordering of the claims in the traces. The analysis can be applied by opening at least two traces in the same view: select multiple traces in the project explorer, right click and select the "Open TRACE view" item. Figure 1 shows an example with three traces that are resemble each other. It is a view on the the traces "reference.etf", ""model-bf.etf" and "model-ff.etf" from the running example.

The distance analysis can be activated with the ![]() menu item.
In this case the view contains three traces, and a reference trace must be selected
(the top trace in our example).
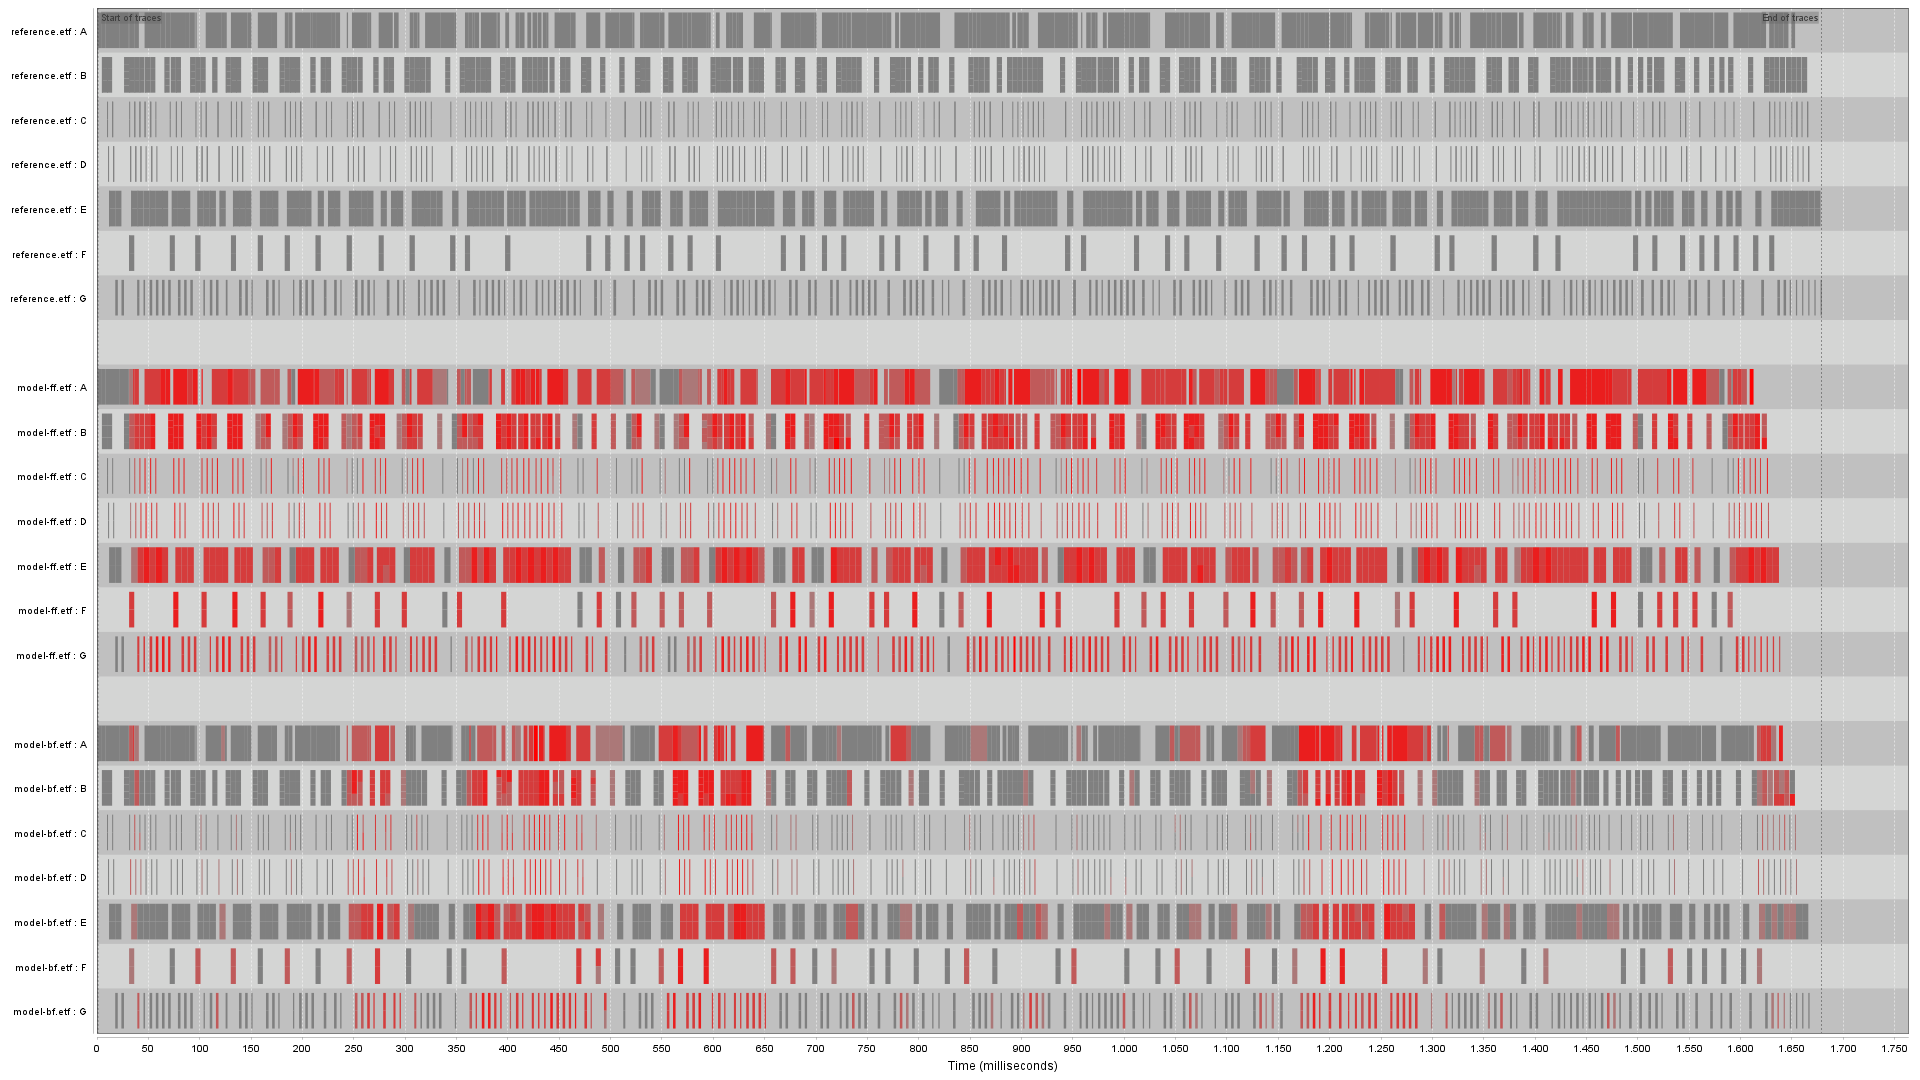
The other two traces are compared to the reference, and the differences with respect to
the reference are highlighted: see Figure 2. Clearly, the middle trace shows much more
red than the bottom trace. The bottom trace is thus closer to the reference trace.
menu item.
In this case the view contains three traces, and a reference trace must be selected
(the top trace in our example).
The other two traces are compared to the reference, and the differences with respect to
the reference are highlighted: see Figure 2. Clearly, the middle trace shows much more
red than the bottom trace. The bottom trace is thus closer to the reference trace.

The pseudo metric is computed based on a graph representation of the traces. A trace is represented by a directed a-cyclic graph (DAG) in which the nodes are the claims and the edges give a temporal order. A claim A has an edge to a claim B if the end of A is not later than the start of B. Note that overlapping claims thus are not connected by a path in the DAG. The transitive reduction of this DAG then is used as follows. Let G1=(V1, E1) and G2=(V2, E2) be two such transitively reduced DAGs. The distance (pseudo metric) between them is defined (using the set symmetric difference Δ) as: |V1 Δ V2| + |E1 Δ E2|.
To compute the distance we thus need a method to determine equality of vertices of different DAGs. The TRACE tool does this based on the attributes of the claims that constitute the vertices of the DAGs. To have a useful comparison, it is therefore essential that the attributes of the traces are aligned. A clear indication that this is not the case, is if the traces color completely red.
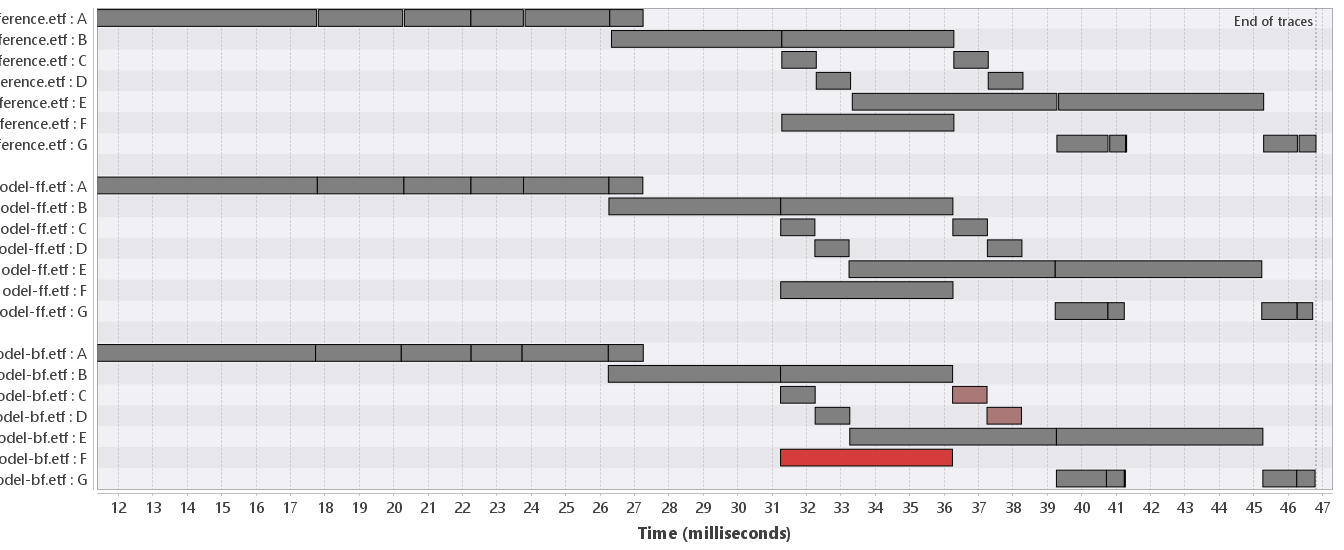
Next, we show a detail of Figure 2 above to explain the coloring in more detail.
We have only included the claims with value 2 or 3 for the attribute "id". This gives Figure 3.
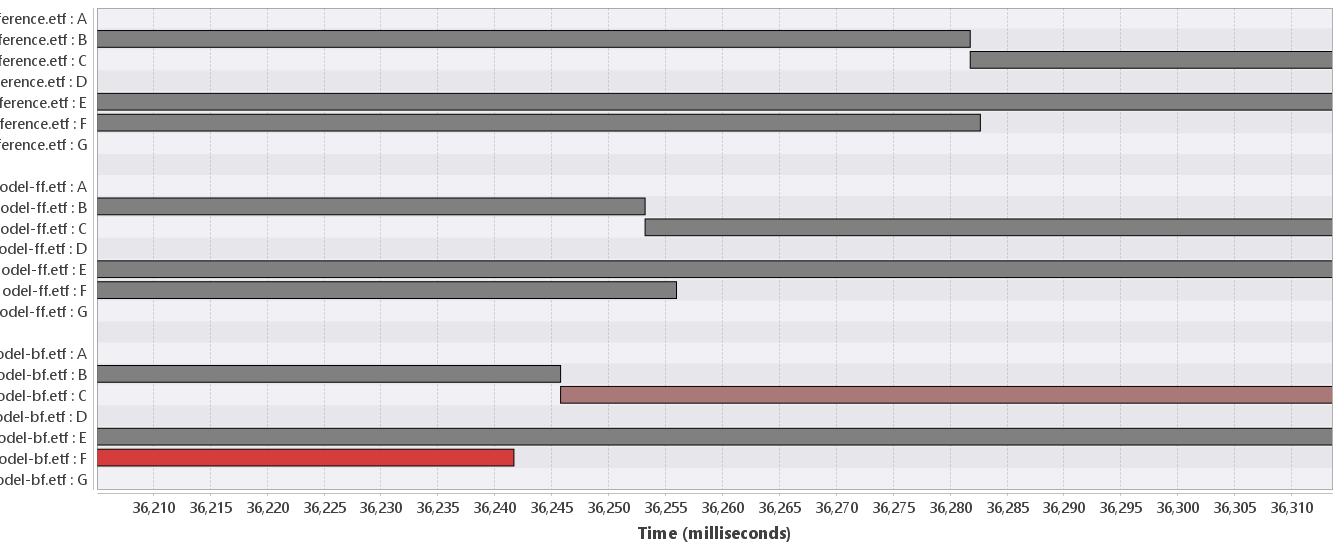
Only the bottom trace differs from the reference. It is hard to see why this is the case
based on this figure, as the ordering of the claims seems similar in all three traces.


The distance |V1 Δ V2| + |E1 Δ E2| is computed as follows:
- |V1 Δ V2| = |∅| = 0 because the traces have exactly the same set of vertices
- |E1 Δ E2| = | E1 \ E2| ∪ | E2 \ E1 | = |{F->C}| + |{F->D}| = 2
Note that this pseudo metric is only about order, and not about absolute time. If we would multiply the timestamps in the bottom trace with 100, then the bottom trace would, according to this pseude metric, still be closer to the top trace than the middle trace. Therefore, this pseudo metric is especially for comparing traces that are almost identical.