TRACE Resource-usage analysis
NOTE: Analysis is applied to the current filtered view
Claims on resources can be analyzed with the resource-usage analysis under the ![]() menu. It has two items: Resource-usage graph, and resource-usage histogram.
menu. It has two items: Resource-usage graph, and resource-usage histogram.
Resource-usage graph
The resource-usage graph analysis creates a continuous signal for the resource-usage of selected resources. The analysis has two parameters:- Use resource amount: this boolean parameter indicates whether the range of the created signal is the amount of the resource that is claimed (true value), or the number of concurrent claims on that resource (false value).
- Window width (in seconds): indicates whether a sliding-window average of the instantaneous signal should be computed. A window width of 0 computes the instantaneous resource-usage signal. If the window width is larger than 0, then the average of the instantaneous signal in the specified window is used.

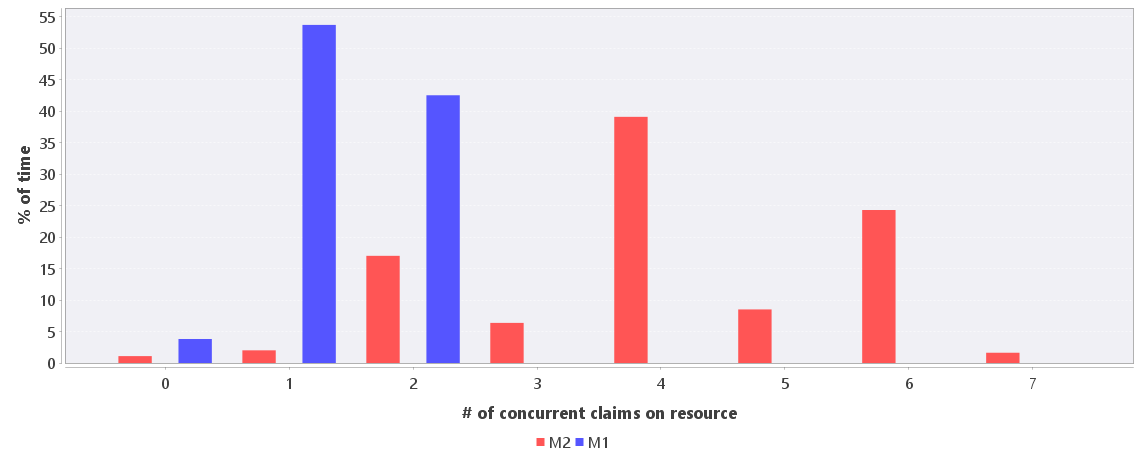
Resource-usage histogram
The resource-usage histogram analysis creates a histogram of the % of time that there are a certain number of concurrent claims on the resource. This is useful to see, for instance, how much of the time there are more processes running on a CPU than there are cores. The histogram is shown in a separate view, see Figure 2 for example.