Nebula Visualization Widgets
Visualization
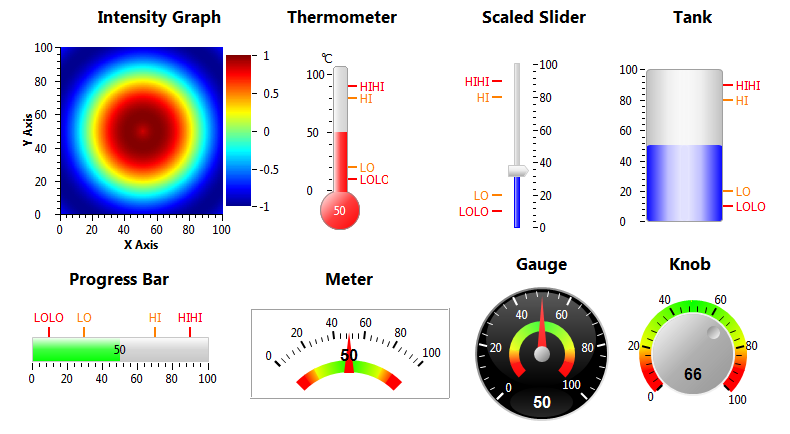
Nebula Visualization is a widgets library for data visualization in science, engineering and SCADA areas. These widgets are originally from CSS BOY project.
 |
 |
| More Screenshots... |
Widgets
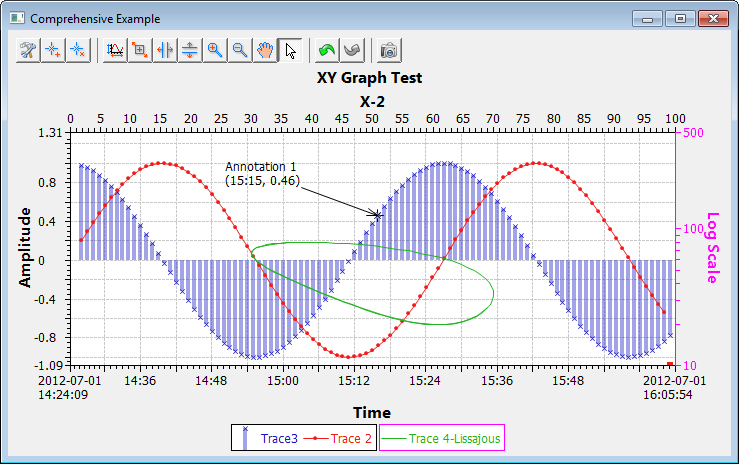
- XY Graph
- Intensity Graph
- Thermometer
- Tank
- Progress Bar
- Meter
- Gauge
- Knob
- Scaled Slider
Functions of XY Graph
- line chart, scatter chart, bar chart, step chart, area chart...
- Zoom in/out, Rubberband Zoom, Horizontal Zoom in/out, Vertical Zoom in/out
- Panning on both graph area and axes
- Auto Scale
- Annotation
- Undo/Redo
- Take snapshot
- Properties configuration dialog
- Multiple axes support
- Log scale, date time format support
- Grouping legends by axes
- Support customized data provider based on a simple interface.
- And more ...
