Working with the Debugger
The purpose of this tutorial
is to teach you how to debug files and applications both remotely and
locally in order to gain maximum efficiency and accuracy from your files
and projects.
Contents:
Purpose and
Usage
PDT 's
Debugging feature can detect and diagnose errors in PHP code situated
locally or on remote servers. The debugger allows you to control the execution
of your program by setting breakpoints, suspending launched programs,
stepping through your code, and examining the contents of variables.
Debugging should be used at stages where your scripts and applications
are formed sufficiently to be tried and tested.
PDT includes
several types of debugging:
Locally Debugging PHP Scripts - Debugging PHP files using
an internal PHP Executable
debugger.
Debugging PHP Web Pages - Debugging files, applications and
projects on your server
Back to Top
Debugging
Local PHP Files (PHP Scripts)
PHP files (PHP Scripts) on your workspace can be debugged locally
using PDT's internal debugger.
Note:
Your server must be running the XDebug in order for remote debugging capabilities to function.
Debugging
a PHP File Locally
Files can be debugged using PDT
's internal debugger.
|
|

|
This procedure demonstrates how
to debug a file using the internal debugger or your server's debugger:
Inside
a PHP project, , called
"debug", and copy-paste the example code into it.
( Click
here to see the code .)
Set a breakpoint
at line 103 by double-clicking the marker bar to the left
of the editor window.
A blue ball will appear. Save the file. Click the arrow
next to the debug button  on the toolbar and select Debug
Configurations... -or- select Run
| Debug Configurations from the main menu -or- right-click
the file in PHP Explorer view and select Debug
Configurations....
A Debug dialog will appear. Double-click the
PHP Script option to create a new debug configuration.
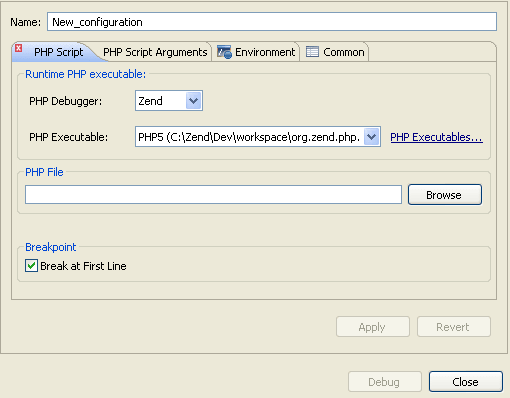
Enter a name for
the new configuration. To debug the file
using your
PHP Executable debugger, select the PHP Executable option
in the Debugger Location category.
Under PHP File,
click Browse and select
the "debug" file. Ensure that the
'Break at First Line' Breakpoint checkbox is selected.
Click Apply
and then Debug. Click Yes
if asked whether to open the PHP Debug Perspective. A number of views
will open with information about your script. The Debug View
is where the debug stack trace is displayed and the debugging
process can be monitored and controlled.
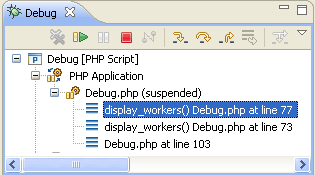
The debugging process will currently
have stopped where your first <?php label appears.
Click the Resume
icon  to continue
to the breakpoint. to continue
to the breakpoint. Click Step Into
 . The Debugger
goes into the function defined in line 103 and advances to
line 77. . The Debugger
goes into the function defined in line 103 and advances to
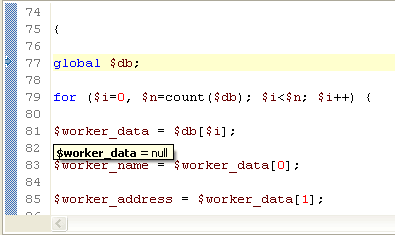
line 77. The Variable view
will now display various information about the relevant variables
and parameters through which the function was reached. In the editor
window, place and hold the cursor over $worker_name, $worker_address,
and $worker_phone. A tooltip appears displaying the variable
values.
Click Step Return.
 The cursor returns
to line 103. The cursor returns
to line 103.
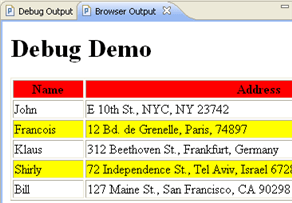
The Debug Output view will display the HTML output created
up until the breakpoint, while the Browser Output view will
show the current output to a browser. In the Debug view,
click Resume  until
the debugging process is terminated. until
the debugging process is terminated.
Notice that as the debugging process progresses, the Debug
Output and Browser Output displays are updated.
The console view
will display any errors or warnings about your script. In
this case, it will display a Notice about an undefined variable
on line 105. Click on the PHP
Perspective icon to return to normal editing mode. To run the debugging
process again, click the arrow next to the debug icon  on the toolbar and select your configuration
-or- select Debug Configurations...
and double-click your configuration from the "Debug"
dialog. on the toolbar and select your configuration
-or- select Debug Configurations...
and double-click your configuration from the "Debug"
dialog.
Clicking the debug icon will debug the last executed launch
configuration. |
|
Back to Top
Note:
Your server must be running the XDebug in order for remote debugging capabilities to function.
Debugging
PHP Applications (PHP Web Pages)
PDT also
allows you to debug applications, projects or files that are already on
the server.
Note:
Your server must be running the XDebug in order for remote debugging capabilities to function.
|
|

|
This procedure demonstrates how
to debug applications on a server:
Inside a PHP project,
create
a new PHP file, called "form1", with the following
code:
<html>
<body>
<form action="welcome.php"
method="post">
Name: <input type="text"
name="name" />
Age: <input type="text"
name="age" />
<input type="submit"
/>
</form>
</body>
</html>
Create a second
PHP file, called "welcome", with the following code:
<html>
<body>
Welcome <?php echo
$_POST["name"]; ?>.<br />
You are <?php echo
$_POST["age"]; ?> years old.
</body>
</html>
Save both files
and copy them to your server. Click
the arrow next to the debug button  on
the toolbar and select Debug Configurations... -or- right-click
the file in PHP explorer or within the file's editor window
and select Debug as | Debug
Configurations.... on
the toolbar and select Debug Configurations... -or- right-click
the file in PHP explorer or within the file's editor window
and select Debug as | Debug
Configurations....
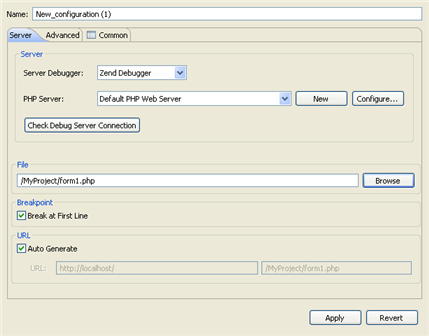
A Debug dialog will appear. Double-click on
the PHP Web Page option to create a new debug configuration. Enter a name for
the new configuration. Select the Debugger from the Server Debugger drop-down
list. Select your server
from the drop-down list.
If you have not configured a server, click the PHP Servers
link to be taken to the PHP Servers
Preferences page.
Under the File/Project
category, click Browse
and select the "form1" file. This will be the file
from which the debugger will start debugging (the 'debug target'.) Ensure that the
URL pointing to the file location is correct.
If this is not correct, unmark the Auto Generate checkbox and
manually change the URL.

Click Apply
and then Debug. Click Yes
when asked whether to open the PHP Debug Perspective. The Debug Perspective
will open with several views relevant to the debugging process
(See 'PHP Debug Perspective'
for more information on the different views.) In the editor
view, you will see the code for the "form1" file. In the Debug view,
click Resume to resume
the debugging process. The browser output
will display a form asking you to enter your Name and Age. Select the browser
view (tabbed with the editor window). This will display the
output of your script in a browser in 'real time'.
Note that this is different from the Browser Output window. In the browser
view, enter your Name and Age and click Submit
Query.

Another editor
tab will open, with the script from the welcome.php file. In the Debug view,
click Resume to resume
the debugging process. The browser output
and browser views will display the final result of your application:
"Welcome [Name].
You are [Age] years old."

The debugging
process will have terminated. Click on the PHP
Perspective icon to return to normal editing mode. To run the debugging
process again, click the arrow next to the debug icon  on the toolbar and select your debugging
configuration. on the toolbar and select your debugging
configuration. |
|
Back to Top
Back to Top
![]()
 on the toolbar and select Debug
Configurations... -or- select Run
| Debug Configurations from the main menu -or- right-click
the file in PHP Explorer view and select Debug
Configurations....

 to continue
to the breakpoint.
 . The Debugger
goes into the function defined in line 103 and advances to
line 77.
 The cursor returns
to line 103.
 until
the debugging process is terminated.
 on the toolbar and select your configuration
-or- select Debug Configurations...
and double-click your configuration from the "Debug"
dialog.