Replay Debugger
Overview
Replay Debugging is a powerful tool that allows you to record the execution of your application and then replay it later. This can be useful for debugging purposes, as it allows you to see exactly what happened during the execution of your application.
Tracing information is already available in 4diac FORTE. However, the current implementation traces a lot of information. Basically, it traces all events, data and also internal data from the function block.
To avoid the overhead of tracing all this information, 4diac FORTE has been extended to support a replay debugging mode. In this mode, only the output events of Service Function Blocks and their related data are traced. In a later stage, the rest of the information is generated using a replay algorithm.
Current Status
The replay algorithm is currently implemented in the development branch of 4diac FORTE.
The code is structured so that the device replayer contains one resource replayer for each resource present in the device. The algorithm receives the output events of the Service Interface Function Blocks and their related data. Then, the original run can be replayed by advancing one event at a time. While replaying, any information to be extracted from the device can be directly retrieved from the resource or device instances used to create the replayer.
4diac FORTE Interface
The replay debugger can be used directly programmatically by instantiating the corresponding class.
On top of the replayer, a Replay Device was added, which offers two OPC UA methods: one for loading existing traces from a given path, and another for triggering one event at a time, which returns the last execute event, or empty if it is the last event.
4diac IDE
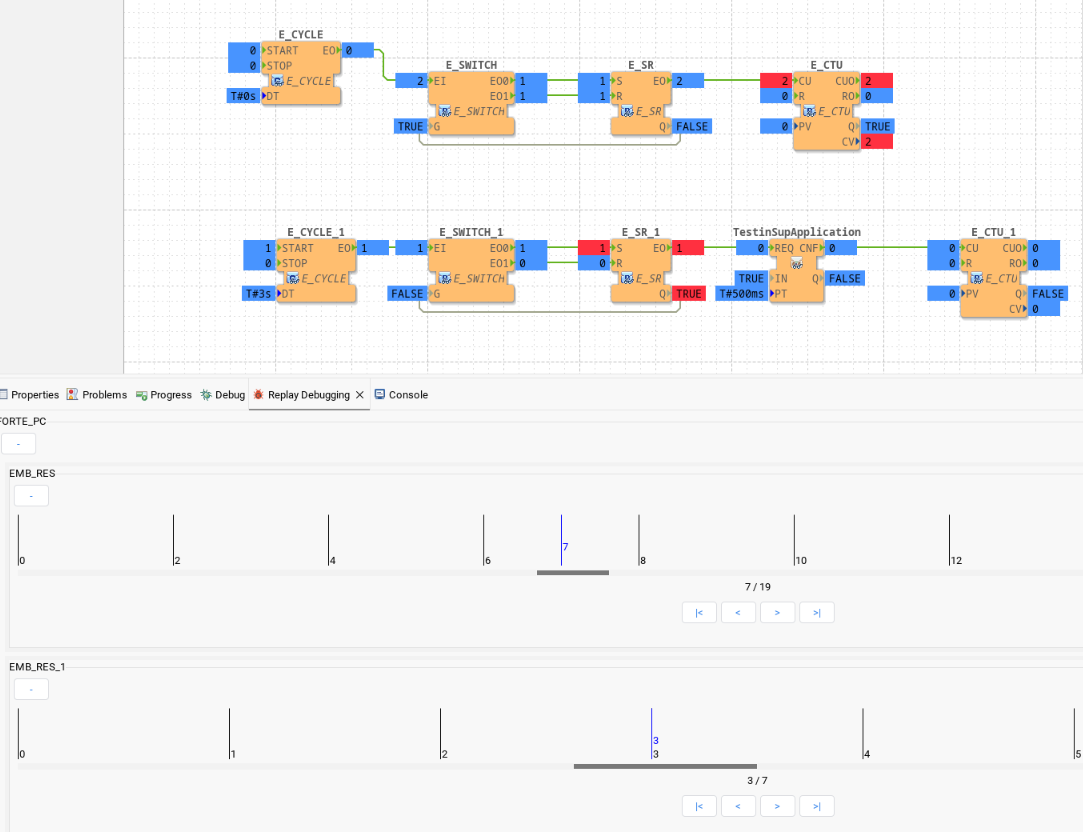
A Graphical User Interface in 4diac IDE allows using the provided interface by 4diac FORTE. The feature provides a timeline of the events for each resource being replayed. Sliders and buttons allow moving forward and backwards over the sequence of events. The state of the application can be observed as usual by using watches of the desired elements and is reflected on these watches as the user moves over the sequence of events.
Testing
The replay algorithm was tested by using different scenarios. The scenarios are tested by letting each scenario run first with the original traces (which traces all events), filtering the output events of Service Interface Function Blocks, executing the replay algorithm, and then comparing the results of the original run with the replayed run.
The tests are located here.
The used scenarios come from the reference examples, in the example repostory
Usage
Generate Traces
To enable the replay debugging capability, 4diac FORTE must be compiled with the FORTE_TRACE_CTF and FORTE_TRACE_CTF_REPLAY_DEBUGGING flags enabled.
This will enable the tracing of the output events of Service Function Blocks and their related data.
When executing 4diac FORTE, provide the -t FOLDER flag, where FOLDER is the path where traces will be saved.
|
Note
|
FOLDER must exist before executing the command for the traces to be saved. |
Start 4diac FORTE as a Replay Device
To later execute the replay algorithm, the Replay Device must be enabled. This is acomplished by compiling 4diac FORTE using the FORTE_REPLAY_DEVICE and FORTE_TRACE_CTF_REPLAY_DEBUGGING flags.
As OPC UA is used to communicate with the replay device, the OPC UA module must also be properly enabled.
One extra step is needed so the traces can be properly processed. In the 4diac FORTE repository, the file src/core/trace/replay_debugging/generated/metadata must be copied into the FOLDER where the traces were saved.
Then, start 4diac FORTE with the parameters -d ReplayDevice.
Start replay debugging in 4diac IDE
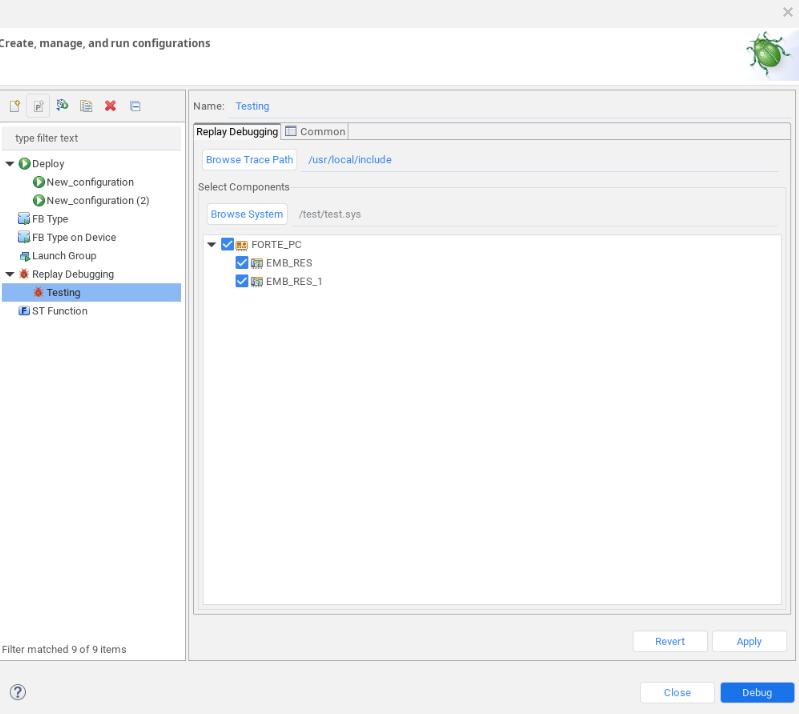
In 4diac IDE, create a new debug configuration of type Replay Debugging, select the device that you want to replay debug, and set the path to the FOLDER where the traces are stored.

|
Note
|
Currently only one device can be replayed per configuration. |
Start the debug configuration. 4diac IDE will connect to the instance of 4diac FORTE started before, load the traces from the provided path, and generate all the data for replay debugging. Open the Replay Debugging view if not already present (Window → Show View → Other… → Other → Replay Debugging).
The view will show a timeline of events for each resource. In the application, toggle the watches you want to observe as usual, and the shown values will change according to the position of the timeslider. Use the buttons to move forward or backward, or just click on the timeline at the desired event number. The values that changed at the current event are marked as red.

Where to go from here?
You can see the supported protocols:
You can see the examples:
If you want to go back to the Where to Start page, we leave you here a fast access
Or Go to top
