Tweaking performance settings
If you run into errors related to running out of memory, you may need to tweak some settings. However, even if you don’t get errors, tweaking settings can significantly improve performance.
This page provides a lot of background information, to allow you to better understand the impact of the various settings. If you wish, you can skip the background information, and go directly to the Quick and dirty solution section.
The following information is available on this page:
Quick and dirty solution
This section explains a 'quick and dirty' solution that gives Eclipse more memory, resolving the most common performance problems and out-of-memory errors.
Find the eclipse-escet.ini file. By default, it is located in your Eclipse ESCET installation directory, except for macOS, where instead it is in the EclipseESCET-vNNN.app/Contents/Eclipse directory, with vNNN the version number, inside the Eclipse ESCET installation directory. Add the following line to the file, as its new last line, to change the maximum available memory to 32 GiB:
-Xmx32gRestart the Eclipse ESCET IDE or command line script to apply the new settings. If the instructions given here don’t fix your problem, or if the IDE or script will no longer start after you changed these settings, you should read the remainder of this page.
Managed memory and garbage collection
Before going into the actual settings, this section provides a little background on managed memory and garbage collection, to make it easier to understand the following sections. The information here is highly simplified, in order not to complicate matters too much.
The Eclipse ESCET IDE and command line scripts run on Java, a computer programming language. The Java Virtual Machine (JVM) manages all memory used by Eclipse, as well as the Eclipse ESCET tools. Not all settings may apply, as different versions of the JVM often change/tweak their garbage collector, settings, defaults, etc. As such, the information on this page should be used to guide you, but may not be completely accurate.
The JVM keeps track of all data that is maintained by the Eclipse ESCET tools, and releases (frees) the memory once it is no longer needed, so that it can be used to store other data. The JVM frees memory by means of a process called garbage collection (GC). Garbage collection is a complex process, but generally it consists of locking the memory to avoid modification during garbage collection, finding the data that is no longer used (mark the garbage), and then freeing the memory associated with that data (sweep the marked garbage).
Different types of memory
In order to understand the memory related settings, some understanding of Java’s memory architecture is essential. The following figure provides an overview of Java’s memory architecture, and the different types of memory that are used:
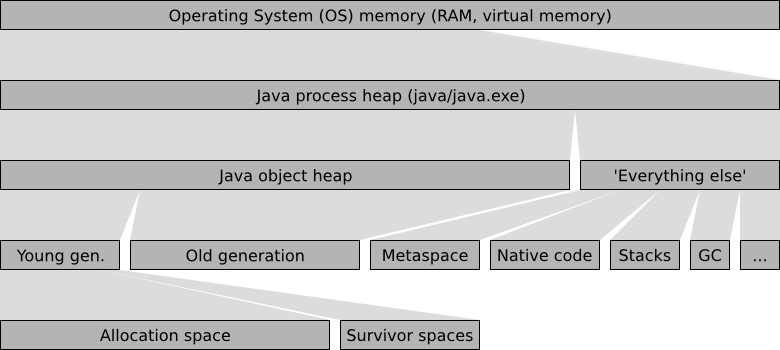
The operating system (OS) has memory available, either as physical RAM, or as virtual memory. When Java is executed, the Java program (java executable on Linux and macOS, java.exe on Windows), becomes one of the running processes. The process uses a part of the operating system’s memory to store its data. This memory is called the Java process heap. The Java process heap is divided into two parts, the Java object heap and 'Everything else'. The Java object heap contains all data actually used by the running Java program, which in our case is the Eclipse ESCET IDE and/or Eclipse ESCET command line scripts. The 'Everything else' part contains various data, mostly used by the JVM internally.
Java uses a generational garbage collector. New data, called objects in Java, are created in the young generation, or more specifically, in its allocation space (also called eden space). When the young generation becomes full, the garbage collector will remove all garbage (no longer used data) using a minor collection, which removes garbage from the young generation. The garbage collector uses the survivor spaces to store the surviving objects. Objects that survive a few minor collections are moved to the old generation, which stores the longer living objects, as well as the larger objects that don’t fit in the young generation, which is usually much smaller than the old generation. When the old generation becomes full, the garbage collector performs a major collection removing garbage from the entire Java object heap, which is much more work, and thus much more costly than a minor collection.
The 'Everything else' part of the Java process heap contains various data used internally by the JVM. This includes the 'Metaspace' with all the Java code of Eclipse and our own plugins, the values of constants, etc. It also includes the native code, the highly optimized code generated for the specific architecture of your machine, that can actually be executed on your processor. Furthermore, it includes the stacks of all the threads that are running in parallel. There is also a part that contains the data maintained by the garbage collector itself, for administrative purposes. The 'Everything else' part contains various other types of data, that are irrelevant for the current discussion.
Benefits of increasing the available memory
If Java runs out of available memory, our applications running in Eclipse will terminate with an 'out of memory' error message. In such cases, increasing the available memory will likely solve the problem. However, even if you don’t run out of memory, increasing the amount of memory that is available to Java can significantly improve Java’s performance.
The garbage collector performs a minor collection when the young generation becomes 'full'. Here, 'full' doesn’t necessarily mean 100%, as Java may e.g. try to keep the heap about 40% to 70% filled. Increasing the size of the young generation makes it possible to allocate more new objects before the young generation becomes 'full'. During garbage collection, program execution may become halted, to ensure that memory doesn’t change during the collection process. The longer one can go without garbage collection, the less halting, and thus the greater the performance of the program.
If an application uses a lot of data that lives for longer periods of time, the old generation may become mostly filled with data. It then becomes harder and harder for the garbage collector to move objects from the young generation to the old generation. This may be caused by fragmentation, due to some objects from the old generation being removed by the garbage collector. In such cases, if the gaps are too small to hold the new objects, the old generation may need to be compacted, a form of defragmentation. After compaction, the single larger gap hopefully has more than enough free space to contain the new objects. The compaction process is expensive, as a lot of objects need to moved. If the situation gets really bad, Java may need to spend more time performing expensive garbage collection operations than it spends time on actually executing the program you’re running. By increasing the size of the old generation to more than the application needs, a lot more free space is available, reducing the need for frequent compaction, thus significantly increasing the performance of the application.
These are just some of the reasons why increasing the amount of available memory can improve program execution times, even though enough memory was already available to complete the given task. In general, the more memory Java has, the better it performs.
Available settings
The JVM has way too many options to list here, but the settings listed in this section are of particular practical relevance. Most of the settings affect memory sizes. Each setting is described using a name, a command line syntax (between parentheses), and a description. The command line syntax is used to specify the setting, as explained in the Changing memory settings section.
-
Initial Java object heap size (
-Xms<size>)The size of the Java object heap when Java starts. Java will increase and/or decrease the size of the Java object heap as needed.
-
Maximum Java object heap size (
-Xmx<size>)The maximum size of the Java object heap. Java will increase the size of the Java object heap as needed, but never to more than the amount indicated by this setting.
-
Minimum percentage of free heap space (
-XX:MinHeapFreeRatio=<n>)Java will increase the size of the Java object heap as needed. Frequent heap resizing is costly. To prevent frequent resizing, the JVM allocates more space than it really needs. This way, a lot of new objects can be allocated before running out of space, which requires the heap to be increased again.
This setting indicates the desired minimum percentage of free heap space after each garbage collection operation. This is a desired percentage only, and if it conflicts with other settings, it is ignored. For instance, if this setting is set to 40%, but 80% of the maximum heap size is in use, only 20% free space may be allocated.
-
Maximum percentage of free heap space (
-XX:MaxHeapFreeRatio=<n>)Java will decrease the size of the Java object heap if possible, to ensure that Java doesn’t keep claiming memory that it no longer needs. Frequent heap resizing is costly. To prevent frequent resizing, the JVM allocates more space than it really needs. This way, a lot of new objects can be allocated before running out of space, which requires the heap to be increased again.
This setting indicates the desired maximum percentage of free heap space after each garbage collection operation.
-
Ratio of young/old generation sizes (
-XX:NewRatio=<n>)The ratio (1:n) of the young generation size to the old generation size. That is, with a ratio of 1:8, the old generation is 8 times as large as the young generation. In the command line syntax, the
8is specified.
-
Ratio of allocation/survivor space sizes (
-XX:SurvivorRatio=<n>)The ratio (1:n) of the survivor spaces size to the allocation space size. That is, with a ratio of 1:8, the allocation space is 8 times as large as the survivor space. In the command line syntax, the
8is specified.
-
Use garbage collector overhead limit (
-XX:+UseGCOverheadLimit)By default, the JVM uses a policy that limits the proportion of the VM’s time that is spent on the garbage collector. If the limit is exceeded, the garbage collector has trouble doing its work (usually due to too little free memory), and performance is impacted so badly, that executed is practically halted. Instead of continuing, the JVM will issue an 'out of memory' error.
-
Maximum code cache size (
-XX:ReservedCodeCacheSize=<size>)The maximum size of the code cache for native code.
-
Compile threshold (
-XX:CompileThreshold=<n>)By default, the JVM runs in mixed mode, which means that some code is interpreted, while other code is compiled to native code, which runs much faster. Since compilation takes time as well, compilation is only performed for often used code.
This setting indicates the number of method (a peace of Java code) invocations/branches before a method is compiled for improved performance.
-
Thread stack size (
-Xss<size>)The size of the stack of each thread.
The <size> part of the command line syntax is to be replaced by an actual size, in bytes. The size can be postfixed with a k or K for kibibytes, an m or M for mebibytes, or a g or G for gibibytes. For instance, 32k is 32 kibibytes, which is equal to 32768, which is 32,768 bytes.
The <n> part of the command line syntax is to be replaced by an integer number. The values that are allowed are option specific.
The + part of the command line syntax indicates that the corresponding feature is to be enabled. Replace the + by a - to disable the feature instead of enabling it.
Changing memory settings
There are several ways to supply the command line arguments for the settings to Java. The easiest way to do it, when using Eclipse, is to modify the eclipse-escet.ini file. By default, it is located in your Eclipse ESCET installation directory, except for macOS, where instead it is in the EclipseESCET-vNNN.app/Contents/Eclipse directory, with vNNN the version number, inside the Eclipse ESCET installation directory.
Each of the settings you want to change should be added to the eclipse-escet.ini text file, in the command line syntax. Each setting must be put on a line by itself. Furthermore, all these JVM settings must be put after the line that contains -vmargs. Settings on lines before the -vmargs line are the settings for the launcher that starts Eclipse, rather than to the JVM.
Note that the default eclipse-escet.ini file supplied with Eclipse may already contain some of the settings. If so, don’t add the setting again. Instead, change the value of the existing setting. The settings that are present by default, as well as their values, may change from version to version.
After modifying eclipse-escet.ini, restart the Eclipse ESCET IDE or command line script for the changes to take effect.
Miscellaneous troubleshooting
If the ECLIPSE_HOME environment variable is defined, that directory is used instead of the default directory, to look for eclipse-escet.ini. However, most users should not be affected by this.
Using the -vmargs command line option replaces the similar settings from the eclipse-escet.ini file. For most users, this will not be applicable. If --launcher.appendVmargs is specified either in the eclipse-escet.ini file, or on the command line, the -vmargs settings of the command line are added to the eclipse-escet.ini file -vmargs instead of replacing them.
Practical hints to solve performance and memory problems
In general, giving Java extra memory only makes it perform better. As such, increasing the maximum Java object heap size (-Xmx), is generally a good idea, if you have enough free memory.
If you actually run out of memory, Java will emit a java.lang.OutOfMemoryError, with a message to indicate the type of memory that was insufficient. Below some common out of memory error message are listed, with possible solutions:
-
java.lang.OutOfMemoryError: Java heap spaceThe Java object heap needs more space. Increase the maximum Java object heap size (
-Xmxsetting).
-
java.lang.OutOfMemoryError: GC overhead limit exceededThe 'use garbage collector overhead limit' feature is enabled, and the garbage collector overhead limit was exceeded. The best way to solve this, is to make sure the limit is not exceeded, by giving Java more memory, and thus making it easier for the garbage collector to do its work. Increase the maximum Java object heap size (
-Xmxsetting).Alternatively, disable the 'use garbage collector overhead limit' feature (
-XX:-UseGCOverheadLimitsetting, note the-instead of the+). However, this doesn’t solve the underlying problem, as the limit will still be exceeded. Java will try to continue, and will either fail, or be very slow.
-
warning: CodeCache is full. Compiler has been disabled.This message is not a
java.lang.OutOfMemoryError, but may still be printed to the console. It is usually followed bywarning: Try increasing the code cache size using -XX:ReservedCodeCacheSize=. The warnings indicate that the code cache for native code is full. They already indicate the solution: increase the maximum size of the code cache (-XX:ReservedCodeCacheSizesetting).
-
java.lang.OutOfMemoryError: unable to create new native threadA new thread could not be created. The best way to solve this problem is to decrease the maximum Java object heap size (
-Xmxsetting), to make room for the 'Everything else' part of the Java memory, including the stack of the new thread.Alternatively, decrease the size of stacks on all threads (
-Xsssetting). However, decreasing the thread stack size may cause morejava.lang.StackOverflowErrorerrors, and is thus not recommended.
Monitoring Eclipse heap status
In Eclipse, it is possible to observe the amount of Java object heap space that is being used. In Eclipse, open the Preferences dialog, via . Select the General category on the left, if not already selected. On the right, make sure the Show heap status option is checked, and click OK to close the dialog.
The heap status should now be displayed in the bottom right corner of the Eclipse window:

This example shows that the Java object heap (not the Java process heap) is currently 147 MB in size. Of that 147 MB, 62 MB are in use. The entire graph (the gray background) indicates the total heap size (147 MB), while the dark gray part indicates the used part of the heap (62 MB).
Clicking on the garbage can icon, to the right of the heap status, will trigger a major collection cycle of the garbage collector.
By right clicking on the heap status, and enabling the Show Max Heap option, the heap status shows more information:

The text still shows the amount of used heap memory (74 MB) out of the total size of the current heap (147 MB). The scale of the background colors however, is different. The entire graph (the light gray background) now indicates the maximum heap size. The orange part indicates the current heap size. The dark gray part still indicates the part of the heap that is in use. If the used part of the memory gets past the red bar, it will become red as well, to indicate that you are approaching the maximum allowed Java object heap size, and may need to increase it (-Xmx setting).
Hover over the heap status to get the same information in a tooltip.
Monitoring with VisualVM
VisualVM is a tool to monitor, troubleshoot, and profile running Java applications. It can be downloaded from the VisualVM website.
Download the 'Standalone' version, and extract the archive somewhere on your system.
On Windows, start visualvm.exe from the bin directory by double clicking on it. On Linux, start visualvm from the bin directory. On macOS, use the .dmg file as you would any other such file.
After you start VisualVM for the first time, you may see some dialogs. Just go through the steps until you get to the actual application.
In VisualVM, you’ll see the currently running Java applications, for the local system:
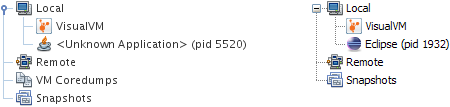
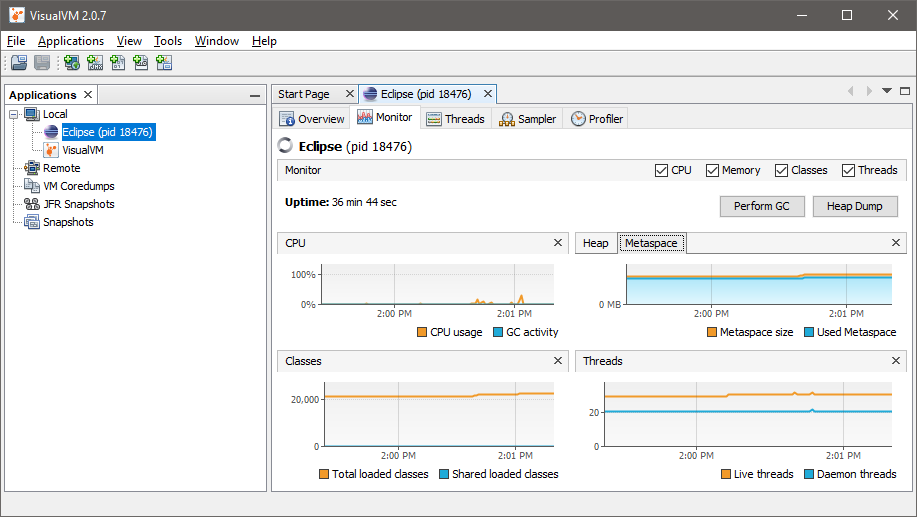
Sometimes VisualVM can identify the Java applications, sometimes it can’t. This may also depend on you operating system, and the version of VisualVM. Find the application you want to know more about and double click it. A new tab opens on the right. The new tab has various tabs of its own:
-
Overview: provides various basic information, including the location of the JVM, its command line settings, etc.
-
Monitor: provides a quick overview of among others the CPU usage, GC activity, Java object heap usage, number of loaded classes, and the number of running threads, over time.
-
Threads: provides an overview of the running threads, and their status, over time. The Thread Dump button can be used to dump the stack traces of all currently running threads.
-
Sampler and Profiler: provide CPU and memory profiling, over time, by using sampling and instrumentation respectively.
The Monitor tab can be used to determine which type of memory should be increased. The Sampler tab can be used to profile an application, and figure out where bottlenecks are. This information can be used by the developers of the application to improve the performance of the application, by removing those bottlenecks.
Via you can access the Plugins window, where you manage the plugins. Various plugins are available. The Visual GC plugin is of particular interest. After installing it, restart VisualVM, or close the tabs of the JVMs you’re monitoring and open them again. You’ll get an extra tab for monitored JVMs, the Visual GC tab. This tab is somewhat similar to the Monitor tab, but shows more detailed information about the garbage collector, its various generations, etc.