Statistics
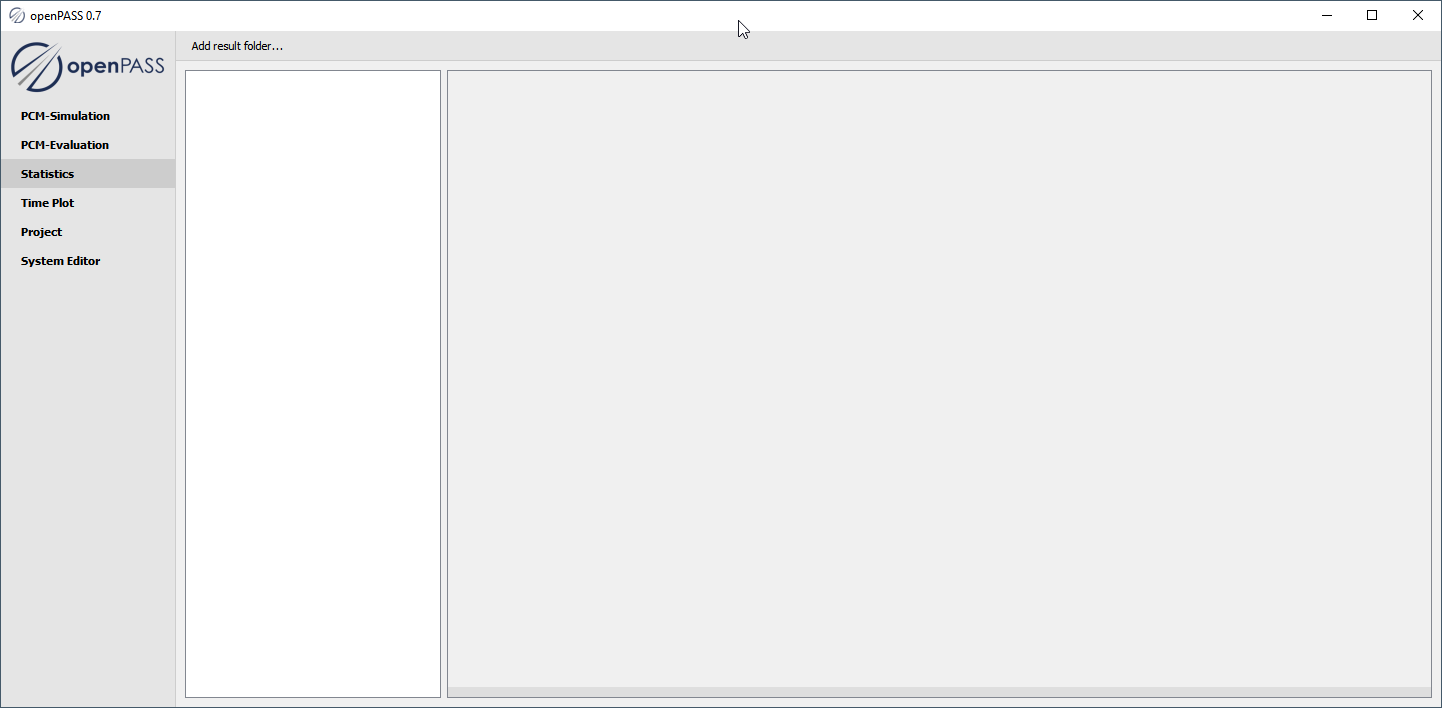
This plugin is used to calculate and show statistics and histograms from a result folder.
Loading Results
Click
Add result folderto choose a result folder of which the statistics shall be calculated.
Note
It is possible to add multiple result folders.
Subsequently selected folders are added to the list in the TreeView
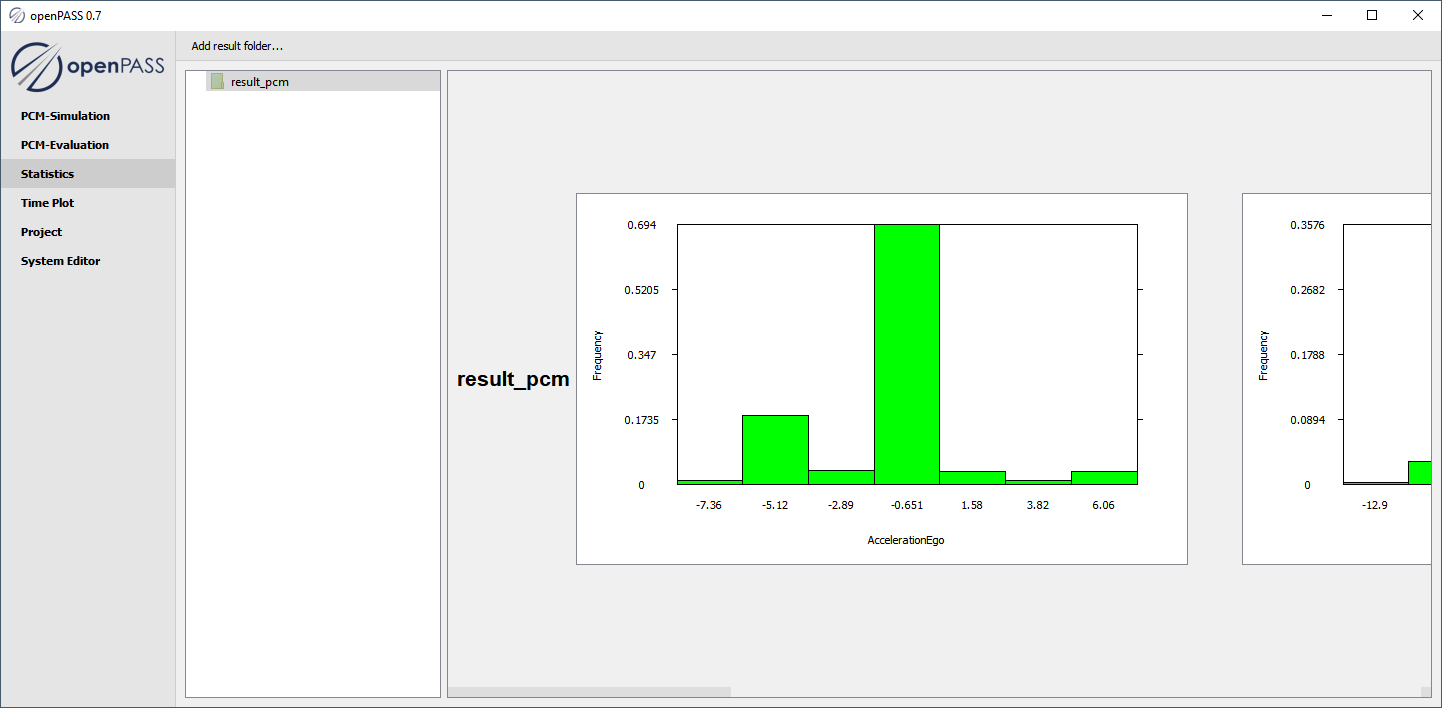
Histograms will be calculated for each folder including subfolders and will be shown in a new row

Evaluating Results
Select a result folder for showing their statistics and histograms
Histograms over a folder are shown in one (scrollable) row of images
Selecting the white background of the folder list clears the histogram preview panel
Each row of histograms contains the contents of the corresponding folder in the folder list
Adding a new folder re-calculates all histograms for each column using a common x-range
Note
Select an input folder that contains files in the following format
Relevant files need ending
.csv`Columns can be separated by comma, semicolon or space
First two columns need frame and id* in header
Warning
For all files in a selected folder and subfolders the headers are read in
All of these files consistent with the first read header are used to calculate histograms for all columns
Files with non-consistent headers are ignored
