TimePlot
This plugin is used to plot trajectories (position, velocity, etc.) over time.
Loading Results
Click
Select result folderto choose a result folder that contains files in the required format (see below) to be plotted.
Evaluating Results
Select an input folder that contains files in this format:
Relevant files need ending
.csvColumns can be separated by comma, semicolon or space
First two columns need frame and id* in header
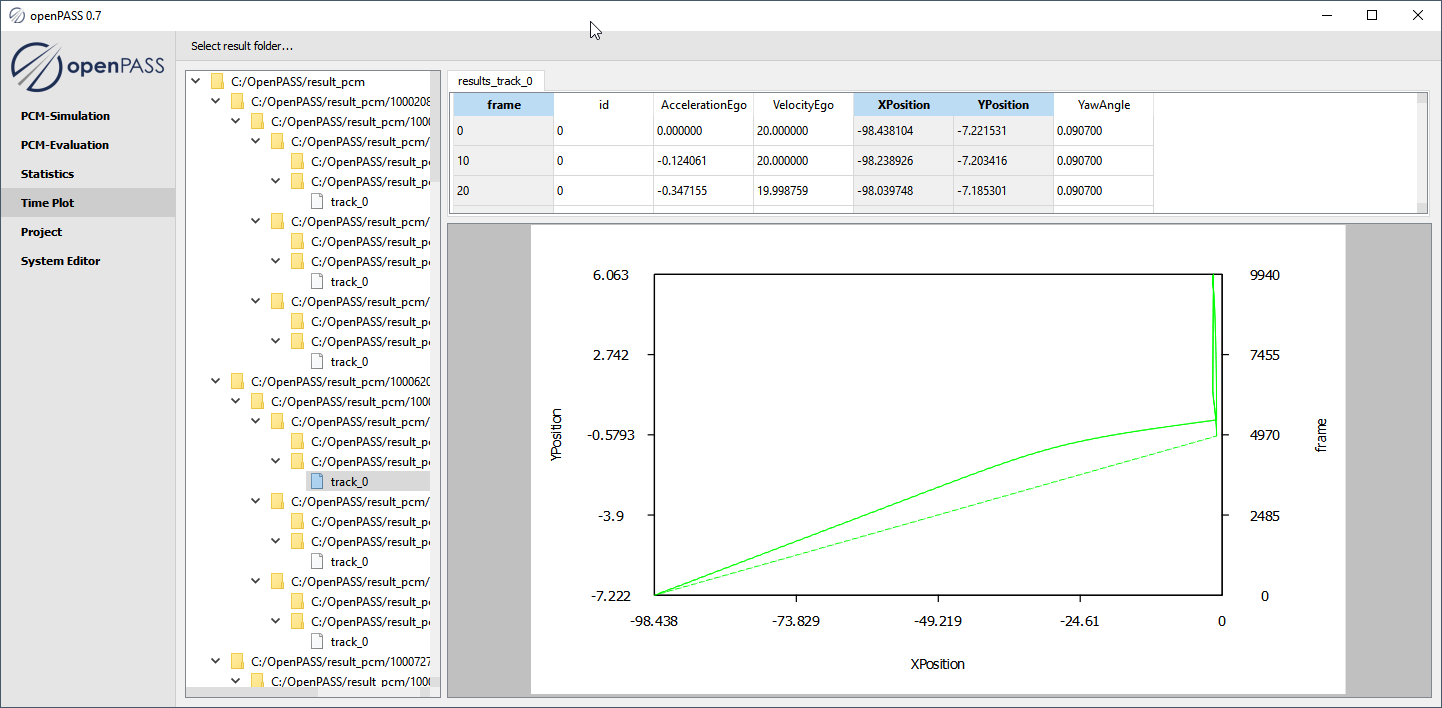
Select table column to be plotted (up to three)
For each open tab the selected columns are plotted
first column selected is shown on the x-axis
second column selected is shown on the y-axis
third column selected is shown on the right y-axis
Note
The track_id items can be selected individually
Selecting the lowest subfolders yields tabs for all contained tracks
Selections can be combined with
Ctrl+selectorShift+select