TRACE Introduction
Understanding system performance
There are many reasons why a system's (time-based) performance can become difficult to understand, or worse, confusing. This is often due to the cross-cutting nature of system performance. An example is a situation in which many concurrent activities share resources. Unforeseen interactions may arise due to the specific timing of the activities. Moreover, if the timing of the activities changes (e.g. due to an upgrade to the computational platform), the interactions may also change, which could result in significantly different behavior. However, insight into the hows and whys of a system's behavior over time is of paramount importance for making effective (design) choices and trade-offs in all phases of the system lifecycle, from the design of a new system to the maintenance of an old legacy system. The TRACE tool can help with this.Execution traces to capture behavior over time
The TRACE tool works with execution traces. An execution trace is a model of system behavior over time. TRACE supports several concepts that can be used within an execution trace:- time-stamped events,
- claims of a resource by an activity (with start and end time stamps),
- sampled or continuous signals
- sampled time-series, and
- dependencies between events or claims.
- All levels of abstraction: the TRACE format can capture all levels of abstraction, from low-level embedded activities to system-level activities.
- Domain-independent: the TRACE format is domain-independent, but nevertheless has the means to be tailored to a domain via user-defined attributes.
- Source-independent: TRACE input can be created from any source, e.g. from the log files of legacy systems or from a discrete-event simulation model.
TRACE methodology

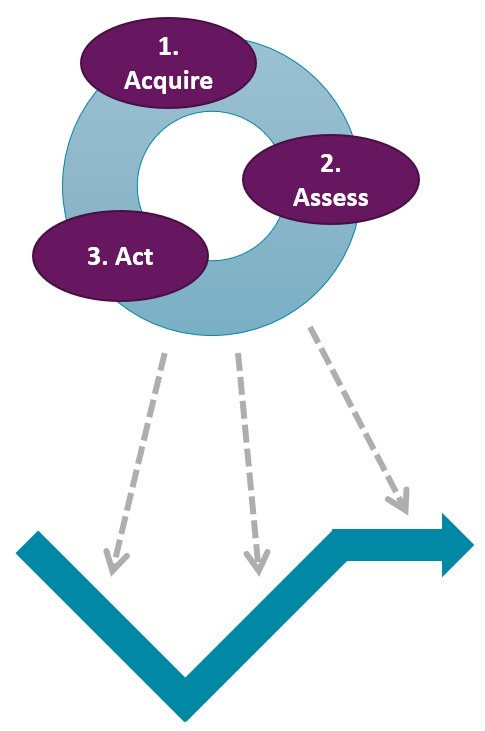
The TRACE methodology for performance engineering of cyber-physical systems consists of three parts: the method, techniques and formalisms. Figure 1 shows the method. First, an execution trace is acquired, for instance, from the logging data of a component, prototype or deployed system. Second, the execution trace is assessed using the TRACE techniques. Third, action is undertaken based on the outcome of the assessment. For instance, a performance bottleneck has been identified and can now be addressed. Because of TRACE's source independence, the TRACE methodology can be applied during every lifecycle phase of a system. During design (left-hand side of the well-known V model of system development), for instance, a discrete-event simulation model can produce execution traces. On the right-hand side of the V, the TRACE tool can be used to analyze the performance of prototypes; the execution trace then is extracted from the logging. TRACE can also be applied to deployed systems by creating execution traces from the system's logging. This can be useful in the contexts of online optimization and digital twinning.

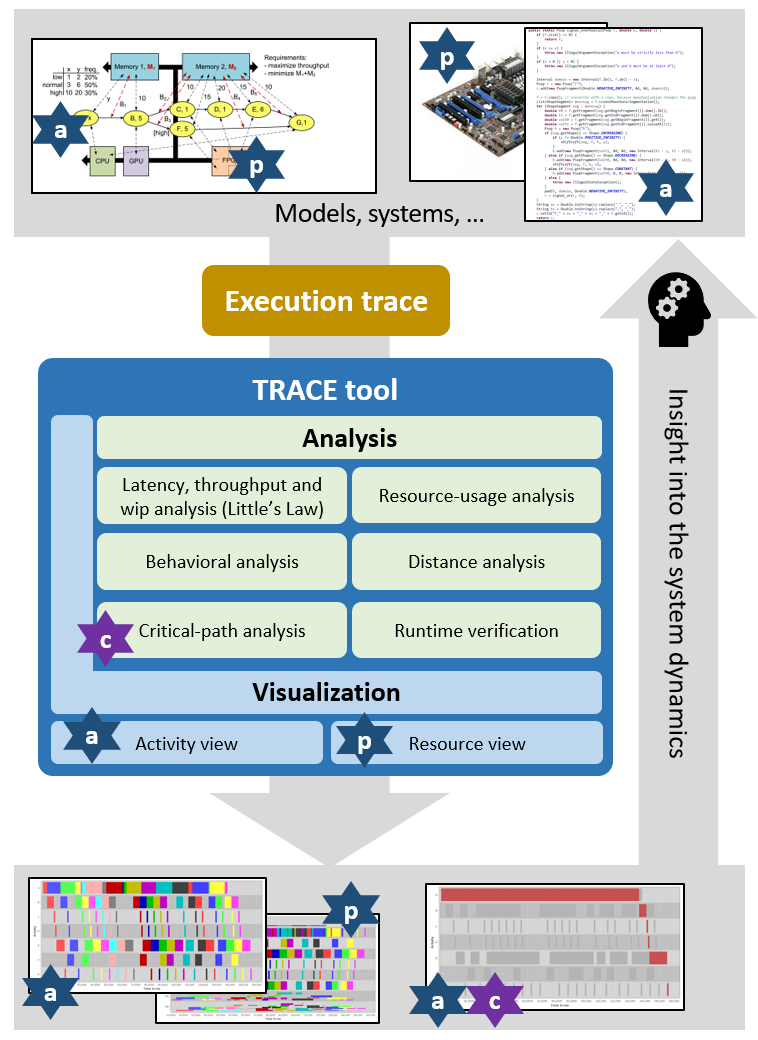
The techniques that TRACE offers fall in two categories: visualization and analysis: see Figure 2. Visualization is based on a Gantt-chart view of the claims, extended with visual elements for the events, signals and dependencies. The TRACE tool offers functionality to pan and zoom. Furthermore, coloring, filtering and grouping of elements can be done based on the user-defined attributes. This is explained in more detail here. TRACE offers several analysis methods, all tailored to performance engineering of cyber-physical systems. These are: resource-usage analysis, behavioral analysis, Little's-Law-based analysis, distance analysis, critical-path analysis, and runtime verification.
Application of the TRACE method and techniques starts with a formalism to define execution traces. A simple human-readable text-based format is supported by default (see here). Furthermore, TRACE provides a language to formally specify temporal-logic-based properties of execution traces for runtime verification (see here). All the TRACE aspects that are mentioned above are explained in more detail in the following sections.