
Replay Debugger
Overview
Replay Debugging is a powerful tool that allows you to record the execution of your application and then replay it later. This can be useful for debugging purposes, as it allows you to see exactly what happened during the execution of your application.
Tracing information is already available in 4diac FORTE. However, the current implementation traces a lot of information. Basically, it traces all events, data and also internal data from the function block.
To avoid the overhead of tracing all this information, 4diac FORTE has been extended to support a replay debugging mode. In this mode, only the output events of Service Function Blocks and their related data are traced. In a later stage, the rest of the information is generated in 4diac IDE using a replay algorithm.
Usage
Generate Traces
To enable the replay debugging capability, 4diac FORTE must be compiled with the FORTE_TRACE_CTF and FORTE_TRACE_CTF_REPLAY_DEBUGGING flags enabled.
This will enable the tracing of the output events of Service Function Blocks and their related data.
When executing 4diac FORTE, provide the -t FOLDER flag, where FOLDER is the path where traces will be saved.
|
Note
|
FOLDER must exist before executing the command for the traces to be saved. |
After the traces are generated, make sure you copy the file from src/core/trace/replay_debugging/generated/metadata into FOLDER.
Start replay debugging in 4diac IDE
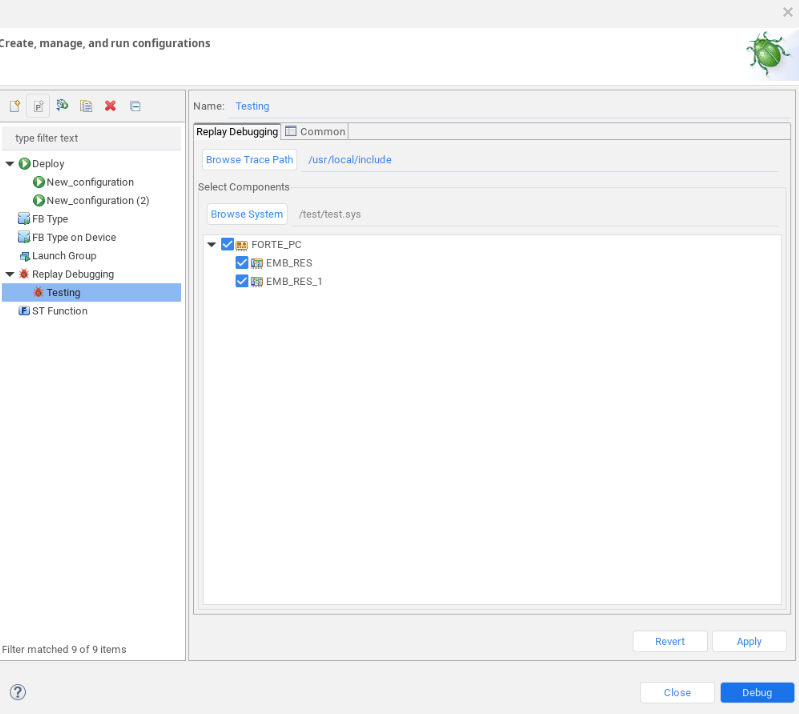
In 4diac IDE, create a new debug configuration of type Replay Debugging, select the resources in the devices that you want to replay debug, and set the path to the FOLDER where the traces are stored. Whenever you select or deselect a device to be replayed (fully or partially), extra fields appear or disappear to set the trace path and remote configurations for each device.
|
Note
|
The Remote checkbox is used for the replay algorithm present in 4diac FORTE. This feature is deprecated and should not be used. |
|
Note
|
The trace path can be left empty, which offers the functionality to manually execute the resources by triggering events as you normally do when monitoring a system, without any previous information from traces. |
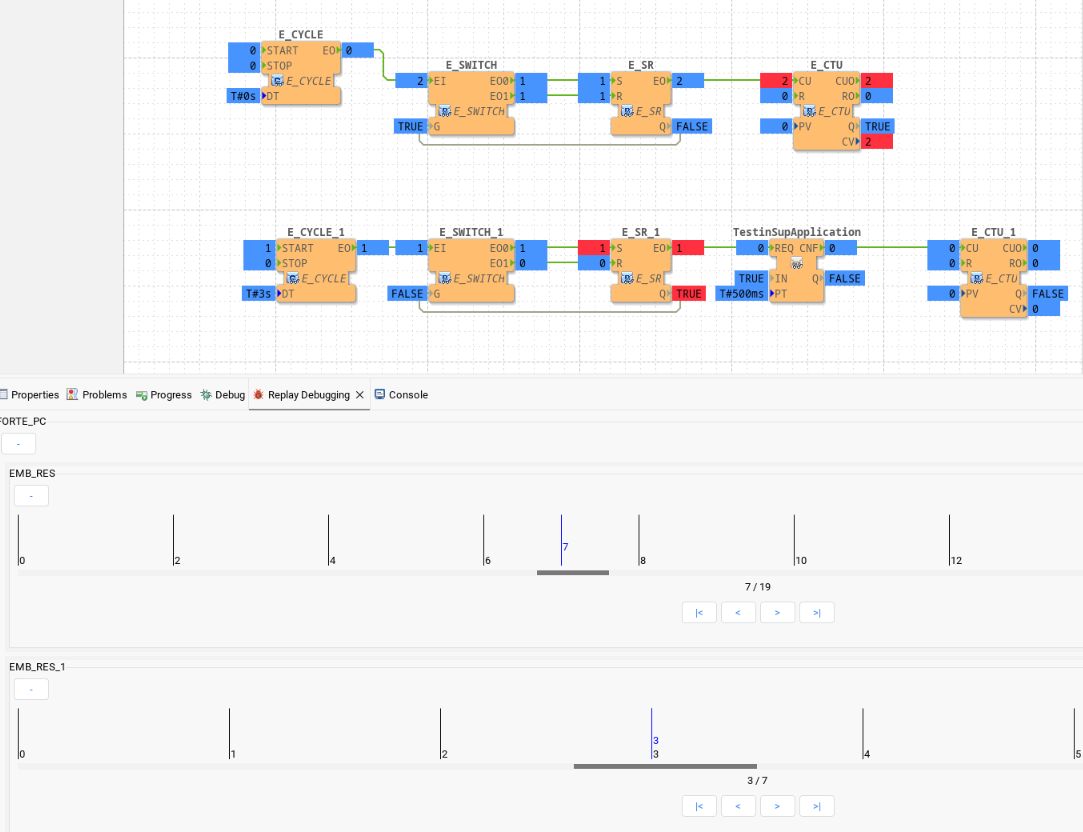
Start the debug configuration. 4diac IDE will load the traces from the provided paths and generate all the data for replay debugging. Open the Replay Debugging view if not already present (Window → Show View → Other… → Other → Replay Debugging).
The view will show a timeline for each resource. A timeline is a series of steps that occurred while the system was running. Each step represents a new state of the resource and they usually represent a new event being triggered in the resource, but it is not restricted to it. This state of the resource at a given step is seen in the application view, when the watch feature is used as usual. That is, changing the current step in the timeline view will update the state seen in the applicaiton view.
Implementation
The replay algorithm is currently implemented in 4diac FORTE and in 4diac IDE. The implementation of 4diac IDE is more advanced and offers many more features. The 4diac FORTE implementation was initially used for testing purposes, but it will be removed in the future. The information that follows refers only to the implementation in 4diac IDE.
The code is structured so that the device replayer contains one resource replayer for each resource present in the device. The algorithm receives the output events of the Service Interface Function Blocks and their related data. Then, the original run can be replayed by advancing one event at a time. While replaying, any information to be extracted from the device can be directly retrieved from the resource or device instances used to create the replayer.
4diac IDE
A Graphical User Interface in 4diac IDE allows creating debugging sessions for replay debugging. For each session, the devices and resources that are to be debugged are selected together with the traces generated by 4diac FORTE. For each resource, a timeline of events is generated, allowing the user to go through each event of the system, forwards or backwards, with full observability of the complete system.
Testing
The replay algorithm was tested by using different scenarios. The scenarios are tested by letting each scenario run first with the original traces (which traces all events), filtering the output events of Service Interface Function Blocks, executing the replay algorithm, and then comparing the results of the original run with the replayed run.
The tests are located here.
The used scenarios come from the reference examples in the example repository
Where to go from here?
You can see the supported protocols:
You can see the examples:
If you want to go back to the Where to Start page, we leave you here a fast access.
Or Go to top