CIF to yEd transformer
The CIF to yEd transformer can be used to transform CIF specifications to yEd diagrams. Several kinds of diagrams can be generated. These diagrams can be used to better understand the specification, to communicate the specification to other, or to be included in reports.
The yEd Graph Editor is an application that can be used to view, create, edit, arrange, import and export various kinds of diagrams. It is freely available and runs on Windows, Linux, and macOS.
The yEd diagrams are generated as GraphML files (*.graphml files), using yEd specific extensions to specify the graphical representation.
Starting the transformation
The transformation can be started in the following ways:
-
In Eclipse, right click a
.cifor.cifxfile in the Project Explorer tab or Package Explorer tab and choose . -
In Eclipse, right click an open text editor for a
.cifor.cifxfile and choose . -
Use the
cif2yedtool in a ToolDef script. See the scripting documentation and tools overview page for details. -
Use the
cif2yedcommand line tool.
Options
Besides the general application options, this application has the following options:
-
Input file path: The absolute or relative local file system path to the input CIF specification.
-
Output file path: The absolute or relative local file system path to the output yEd/GraphML diagram file. If not specified, defaults to the input file path, where the
.ciffile extension is removed (if present), and a.kind.graphmlfile extension is added. For the added default file extension,kindis replaced by the diagram kind (see other option), e.g.model, resulting in file extension.model.graphml. If multiple diagrams are generated, the output file path may not be specified. In such cases, either use the implicit/default file names, or generate one diagram at a time, allowing you to specify an explicit output file path for each of them. -
Diagram kinds: The kinds of diagrams to generate. The default is to generate all the different kinds of diagrams. See the Diagram kinds section for details.
-
Syntax highlighting: Whether to apply syntax highlighting (if option is enabled), or use plain text (if option is disabled). By default, syntax highlighting is enabled. For large diagrams, disabling syntax highlighting can significantly improve the performance, when displaying the diagrams in yEd.
-
Transparent edge labels: Enable option to use a transparent background for edge labels. Disable option to use a light gray background. By default, the option is disabled (a light gray background is used). See the Layout section below for further details.
-
Model filters: The kinds of features to include in the diagram. Only applies to model diagrams. See the Model diagram section for details.
-
Relations: The kinds of relations to include in relations diagrams. The default is to include all kinds of relations. See the Relations diagram section for details.
Supported specifications
For model diagrams:
-
This transformation supports all CIF specifications.
For relations diagrams:
-
CIF specifications with component parameters are not supported.
The transformation does not process any specific annotations. However, annotations may be included in some diagrams, such as model diagrams.
Diagram kinds
Several types of diagrams can be created. They are each described below. Using the Diagram kinds option (see the Options section above), generation of certain kind of diagrams can be enabled or disabled.
In the option dialog, each diagram kind can be enabled and disabled individually, using a checkbox.
From the command line, using the -k or --diagram-kinds option, the names of the diagram kinds, as indicates for each diagram kind in the sections below, should be used, separated by commas. By default, i.e. when the -k or --diagram-kinds option is not used, diagrams are generated for all the different kinds. As an example, consider -k model or --diagram-kinds=model. Only a model diagram is generated, while all other diagrams are not generated.
The diagram kinds that are specified using the option replace the default diagram kinds. However, it is also possible to specify additions and removals relative to the default features, by prefixing features with a + or - respectively. For instance, when using -k -model or --diagram-kinds=-model the default diagrams are generated, except for the model diagram (due to -model). Replacements (no prefix) may not be combined with additions/removals (+ or - prefix).
Specifying a replacement diagram kind twice leads to a warning being printed to the console. Adding a diagram kind that is already present or removing a diagram kind that is not present, also leads to a warning being printed. A warning is also printed to the console if all diagram kinds are disabled, and thus no output is generated.
Model diagram
The option value to use on the command line, for this kind of diagrams, is model.
A diagram of the model itself, with all its details. That is, the diagram can be used instead of the textual representation of the model, without loss of details. Changes with respect to the textual representation include among others elimination of imports, and the loss of comments and textual layout.
All components (automata, groups, automaton instantiations, and group instantiations) and components definitions (automata and group definitions) are visualized in a hierarchical manner, as rectangles contained in other rectangles. Automaton and group instantiations are grouped together into a single node in the diagram. All of them can be closed (collapsed) and opened (expanded) in yEd, allowing to hide unimportant details while focusing on only a part of the diagram. The header of the component or component definition is shown at the top of the rectangle, while for instantiations the word Instantiations is used as header. For groups and group definitions an italic font is used, while for automata, automaton definitions, and automaton/group instantiations, a regular font is used. The background (of the header) is colored as follows:
-
 A component (group/automaton)
 -
 A component definition (group/automaton definition)
 -
 A component instantiation (group/automaton instantiation)
For instantiations, the complete instantiations are shown as code block in the body of the rectangle.
For the declarations (e.g. variables), invariants, I/O declarations (e.g. SVG declarations), etc a block of code is used. Code blocks use header and background colors that are distinct from the colors used for components, component definitions, and component instantiations:
-
 A code block (header)
 -
 A code block (background)
For automata, the locations are visualized as rectangles with rounded colors. Their names (if applicable), invariants, equations, etc are shown as code in the rectangles. The initialization of the location (if present and not false) is visualized as an incoming arrow without source location, with a label indicating the initialization predicates if they are not true. Edges are visualized as arrows between locations, with arrows to the source location itself for self loop edges. The events, guards, now keywords (for urgent edges), and updates are put as labels on the edges. Locations use a background color that is distinct from the colors used for components, component definitions, and code blocks:
-
 A location (background)
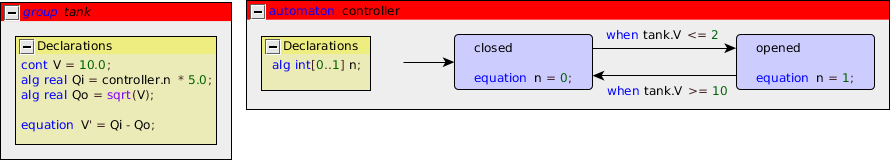
As an example consider the following diagram of the CIF tank example:
Using the Model filters option (see the Options section above), certain features of the model can be included or excluded from the diagram. The table below indicates the features that can be enabled and disabled using the option. The first column lists the names to use on the command line. The second column indicates whether the feature is enabled (included) by default. The third column describes what parts of the model are included/excluded when the feature is enabled/disabled.
| Name | Default | Description |
|---|---|---|
|
|
no |
The I/O declarations, e.g. SVG declarations. |
|
|
yes |
The declarations of the components. Includes the alphabet (if explicitly specified) and monitors of the automata, event declarations, constant declarations, variable declarations, function declarations, invariants, initialization predicates, marker predicates, equations, etc. |
|
|
yes |
The declarations of the locations. Includes the invariants, marker predicates, equations, and urgency. |
|
|
yes |
The guards of the edges. Includes also the urgency of the edge (the |
|
|
yes |
The updates of the edges. |
In the option dialog, each of the features can be enabled and disabled individually, using a checkbox.
From the command line, using the -f or --model-filters option, the names of the different features, as indicates in the first column of the table above, should be used, separated by commas. The features indicated as default in the second column of the table, are enabled when default settings are used, i.e. when the -f or --model-filters option is not used. As an example, consider -f guards,updates or --model-filters=guards,updates. Only the guards and updates are included, while all the other features are excluded.
The features that are specified using the option replace the default features. However, it is also possible to specify additions and removals relative to the default features, by prefixing features with a + or - respectively. For instance, when using -f -loc-decls,+io or --model-filters=-loc-decls,+io the default features are used, with the declarations of the locations disabled (due to -loc-decls), and with I/O declarations enabled (due to +io). Replacements (no prefix) may not be combined with additions/removals (+ or - prefix).
Specifying a replacement feature type twice leads to a warning being printed to the console. Adding a feature that is already present or removing a feature that is not present, also leads to a warning being printed.
Relations diagram
The option value to use on the command line, for this kind of diagrams, is relations.
A diagram of only the event and data relations. The diagram can be used to see which events are used by which automata (are in the alphabet of those automata). It can also be used to see which data (variables, locations, etc) exist in the model and where they are used. Furthermore, it can also be used to see how events and data are passed via automaton and group instantiations. Events, variables, and locations can thereby potentially be renamed if the parameters of the corresponding automaton or group definitions have different names than the events, variables, and locations that are passed via the instantiations.
All components (automata, groups, automaton instantiations, and group instantiations) and component definitions (automaton and group definitions) are visualized in a hierarchical manner, as rectangles contained in other rectangles. Automaton and group instantiations are unfolded to their contents (the body of the corresponding automaton or group definition). Essentially, it is as if component definition/instantiation has been eliminated, but the parameters are kept. Within components and component definition bodies, the components (including the component instantiations) and declarations (event declarations, event parameters, algebraic variables, algebraic parameters, locations, input variables, input parameters, etc) are separated from the component definitions, using additional wrapping boxes. Such wrapping boxes are only added if both components and component definitions are present, and thus separation is needed.
However, all internal details of component instantiations are omitted, as they can be seen in the graphical representations of component definitions (that are instantiated by the instantiations). That is, only the external connections are included, as they show the actual relations (definition here and use there, synchronizations between components, etc). By excluding the internal details, duplication is avoided for multiple instantiations of the same definition. All empty components and components definitions are also excluded, as they only clutter the diagram, and have no relations whatsoever.
All components can be closed (collapsed) and opened (expanded) in yEd, allowing to hide unimportant details while focusing on only a part of the diagram. By default, all components are closed (collapsed). This allows seeing the top level structure. By selectively opening (expanding) components, more details can be shown. It is also possible to focus on a single component, to show only that component and its contents, by selecting in yEd, while a closed or opened component is selected.
The header of the component is shown at the top of the rectangle. It includes the name of the component or component definition, whether it is a group or automaton, whether it is a definition or not, etc. The parameters of component definitions, and the arguments of component instantiations, are all omitted from the headers. For wrappers either Components or Component definitions is used as header text. For groups, group definitions, and group instantiations an italic font is used, while for automata, automaton definitions, automaton instantiations, and wrapping boxes, a regular font is used. The background of the header is colored as follows:
-
A component (group/automaton)
-
A component definition (group/automaton definition)
-
A component instantiation (group/automaton instantiation)
-
 A wrapping box for components (incl. instantiations) or component definitions
Event declarations, discrete variables, continuous variables, algebraic variables, input variables, and locations are all visualized as rectangles with a thick border. The text in the rectangle is a keyword (event, disc, cont, etc), followed by the name of the declaration. For channels (events with a data type), the name is followed by !?~.
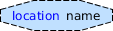
Event, location, algebraic, and input parameters are visualized as octagons with a thin dashed border. The text in the rectangle is a keyword (event, location, etc), followed by the name of the parameter. For channels (events with a data type), the name is followed by the event parameter usage restriction flags (e.g. ! for send, ? for receive, and/or ~ for synchronization). For channel parameters without flags, !?~ is used as text after the name of the parameter.
Uses of events and data are visualized as circles. For uses of events by automata (event in the alphabet of the automaton), the circles indicate the type of use: ! if the automaton sends over the channel, ? if the automaton receives over the channel, and no text if the automaton synchronizes over the event (the event is in the alphabet of the automaton). For data uses, the circles never contain text.
Different colors are used for declarations, parameters, and uses, as well as for events and data:
-
 An event declaration
 -
 An event parameter
 -
 An event usage (automaton sends)
 -
 An event usage (automaton receives)
 -
 An event usage (automaton synchronizes)
 -
 A variable declaration or a location
 -
 A location parameter, an algebraic parameter, or an input parameter
 -
 A data (variable, location, parameter) usage in a component
Each event usage is coupled to the event declaration or event parameter that it refers to, using a directed or undirected edge. For synchronizing usage an undirected edge is used, for send usage a directed edge from the usage to the event declaration or event parameter is used, and for receive usage a directed edge from the event declaration or event parameter to the usage is used.
Each data usage in a component not related to a declaration (variable, location, or parameter) gets a circular node to indicate usage. It is coupled to the declaration it uses, via a directed edge from the declaration to the use, to indicate the flow of data. Duplicate edges are avoided.
Event parameters of component instantiations are coupled to the actual event (or event parameter) that is provided by the instantiation, using a directed or undirected edge. If the parameter is a channel parameter that explicitly allows sending (has a ! flag) and doesn’t allow receiving (has no ? flag), a directed edge from the parameter to the actual event is used. If it explicitly allows receiving (has ? flag) and doesn’t allow sending (has no ! flag), a directed edge from the actual event to the parameter is used. If it explicitly allows both sending and receiving (has both a ! and a ? flag), a bidirectional edge is used. In all other cases, an undirected edge is used.
Location parameters of component instantiations are coupled to the actual location (or location parameter) that is provided by the instantiation, using a directed edge from the actual location to the parameter, to indicate the flow of data. Input parameters are also coupled to the actual input variable (or input parameter) that is provided. Similarly, algebraic parameters are related to the arguments. However, for algebraic parameters, an expression may be provided. For each variable, location, and parameter used in the argument, a directed edge is added. Duplicate edges are avoided.
From declarations (variables, locations, parameters), directed edges are included in the diagram for all relations to other declarations. For instance, if a discrete variable is initialized using the value of an algebraic variable, there will be an edge from the algebraic variable to the discrete variable. Similarly, if in a continuous variable is used in a guard, there will be an edge from the continuous variable to the location that contains the edge. Duplicate edges are avoided.
Relations via annotation argument values are ignored.
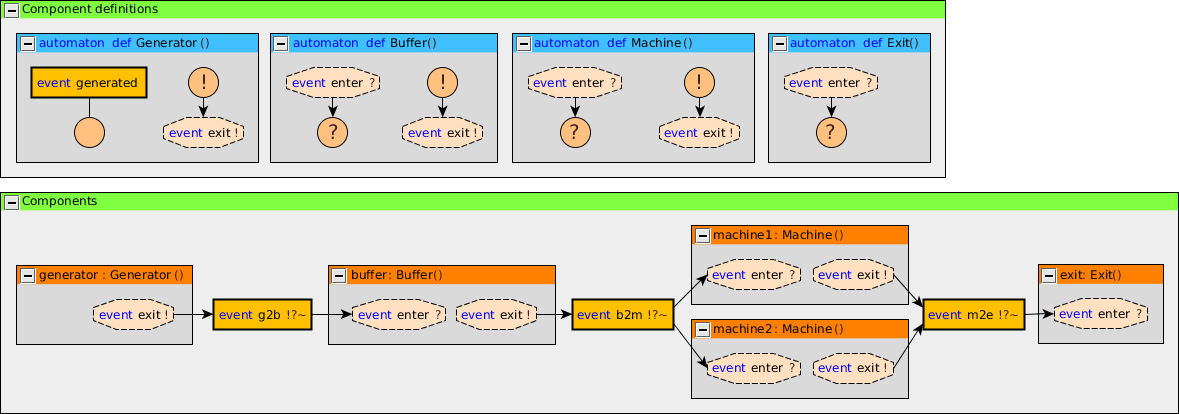
As an example consider the following relations diagram of the CIF 'machine/buffer' example, showing only the event relations:
Using the Relations option (see the Options section above), certain kinds of relations included or excluded from the diagram. By default all kinds of relations are included. The following kinds of relations are available:
-
event relations (
event) -
data relations (
data)
In the option dialog, each of the features can be enabled and disabled individually, using a checkbox.
From the command line, using the -r or --relations option, the names of the different kinds of relations, as indicates between parentheses above, should be used, separated by commas. As an example, consider -r event or --relations=event. Only the event relations are included, while all the other relations are excluded.
The kinds that are specified using the option replace the default kinds. However, it is also possible to specify additions and removals relative to the default kinds, by prefixing names with a + or - respectively. For instance, when using -r -event or --relations=-event the default kinds are used, with the event relations excluded (due to -event). Replacements (no prefix) may not be combined with additions/removals (+ or - prefix).
Specifying a replacement kind type twice leads to a warning being printed to the console. Adding a kind that is already present or removing a kind that is not present, also leads to a warning being printed. Finally, generating a relations diagram without any relations also leads to a warning being printed.
Layout
The generated diagrams can be opened in the yEd Diagram Editor using . After opening the diagram, all nodes overlap, as the generated diagrams don’t contain any positions for them. yEd can automatically layout the diagram. Several layout algorithms are available in the Layout menu.
Good results for model diagrams can often be obtained by using the Orthogonal layout. Select to show the Orthogonal Layout window. Click the Dock button to dock the window. Once docked, select Integrated for the Edge Labeling option (Labelling category) and Free for the Edge Label Model option (Labelling category). Also enable the Consider Node Labels option (Labelling category). Press the Apply changes button (the green rectangle) at the top of the docked window to apply the changes to the layout.
You may want to try different values for the Grid option (Layout category), to get more or less spacing between nodes. Once you change a value, just apply the new layout, as before. The automatic layout algorithms aren’t perfect, but they are usually a good starting point.
By default, edge labels have a light gray background. This makes them easier to read when placed on the edges. By changing the Edge Label Model option (Labelling category) from Free to Side Slider, labels are not placed on the edges, but besides them. However, this often leads to some overlap, requiring manual layouting. If the Side Slider variant is used, you may want to change the background of the edge labels to be transparent. This can be achieved by enabling the Transparent edge labels option (see the Options section above).
Good results for relations diagrams can often be obtained using the One-Click Layout functionality of yEd. Select or use the corresponding toolbar button. This option is only available in yEd 3.14 or newer.
You can also close (collapse) and open (expand) groups and apply the layout again.
yEd has many more options. You can explore them using the included help text, by selecting .
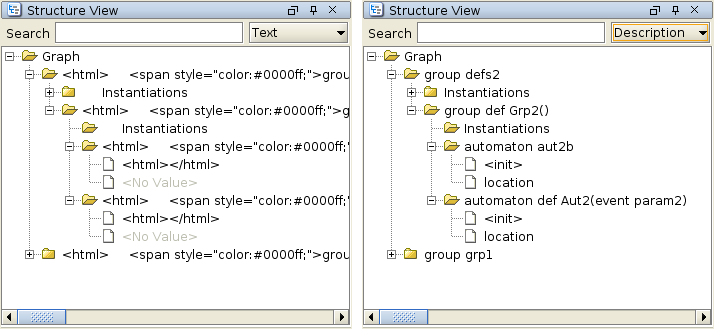
Structure View
yEd has a Structure View window that can be enabled via . The Structure View window can be used to see and navigate the structure of the CIF model. By switching from Text to Description (see upper right corner of the Structure View window), useful descriptions are shown for all elements. Furthermore, switching also ensures that the HTML code that is used for syntax highlighting is not shown in the Structure Viewer (if syntax highlighting is enabled, see the Options section above). The following image shows the difference: