Event-based synthesis analysis
While developing a controller with supervisory controller synthesis, the result is not always what you expect. To assist, the synthesis analysis tool has been developed. Its primary purpose is to explain why certain states or edges have been removed.
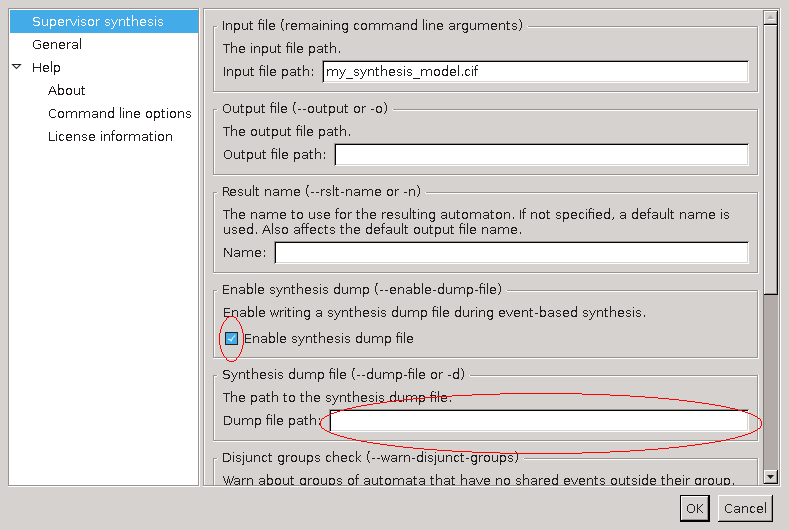
To use the tool, enable creation of the Synthesis Dump file during synthesis, using the Enable Synthesis dump option or the Synthesis dump file option of the Supervisor synthesis tool.
By double clicking the generated dump file, or by right-clicking the dump file and selecting Analyze Synthesis Result, the analysis tool is started. It loads the file (which can take a some time if the file is big), eventually giving the following display:
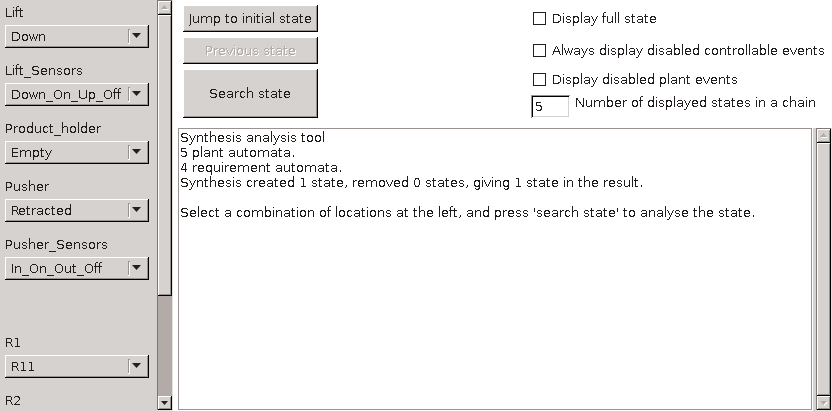
At the left, all automata with their initial location are shown. You can select a different supervisor state by changing these locations. At the top, in the middle, there are three buttons. The bottom Search state button is used to search the information about a supervisor state selected at the left. The Jump to initial state button resets the automata to their initial state, useful when you want to start again. The middle Previous state button is disabled now, but allows you to go back to the previous state.
At the right, a number of options are available in case the displayed information is not sufficient. These are explained later.
Below the buttons and options is the report area, which just displays some statistics. When you press Search state, the tool analyzes the selected state at the left. Depending on what happened with that state, different things may be shown. In this example, you get:
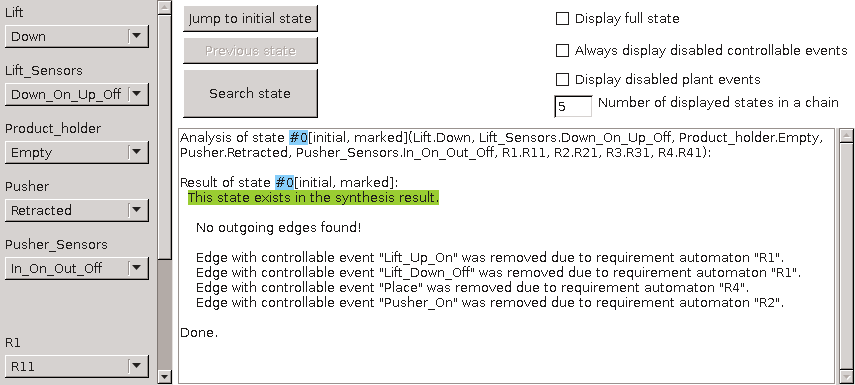
The report area changes to display the information about the selected state. It starts with the internal number of this state (#0), and its properties. The initial means this state is the initial state, marked means this state is marked. Then follows an explicit list of locations of every automaton. It is the same list as the selected locations at the left, but more compact. Then the analysis result is shown. This state exists in the supervisor, and has no outgoing edges. In other words, this state is the only state in the result. Below it, the edges removed by the requirements are listed, together with the name of the requirement automaton that disabled it.
Not displayed here is the list of edges removed due to plant automata. These can be displayed by enabling the Display disabled plant events option at the top-right.
If a state does have outgoing edges, these are displayed as well:
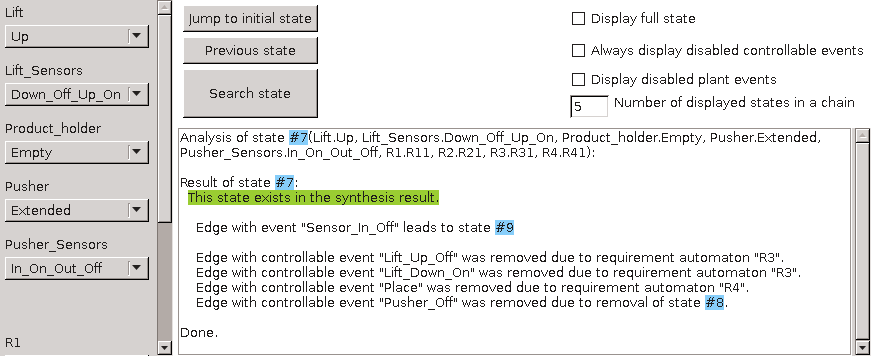
State #7 has one outgoing edge, leading to state #9 using event Sensor_In_Off. The last line with the removed controllable events displays a removed edge because destination state #8 was removed.
If you want to know what states #9 or #8 are, you can enable the Display full state option at the top-right, and the tool will display the full list of automaton locations with each state, just like the first line in the report. You can also go to these states, by double-clicking at the blue area. If you click at removed state #8 you get a display like:
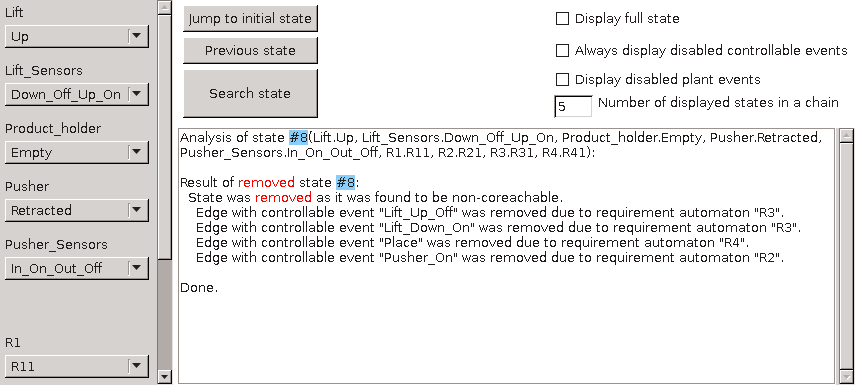
As expected, the analysis tools displays that the state was removed, apparently because it was not co-reachable. Again you get the list of removed edges from this state, as an aid to decide which requirement should be checked, if this was not expected.
The final screenshot shows what is displayed if a state is removed because another state is removed:
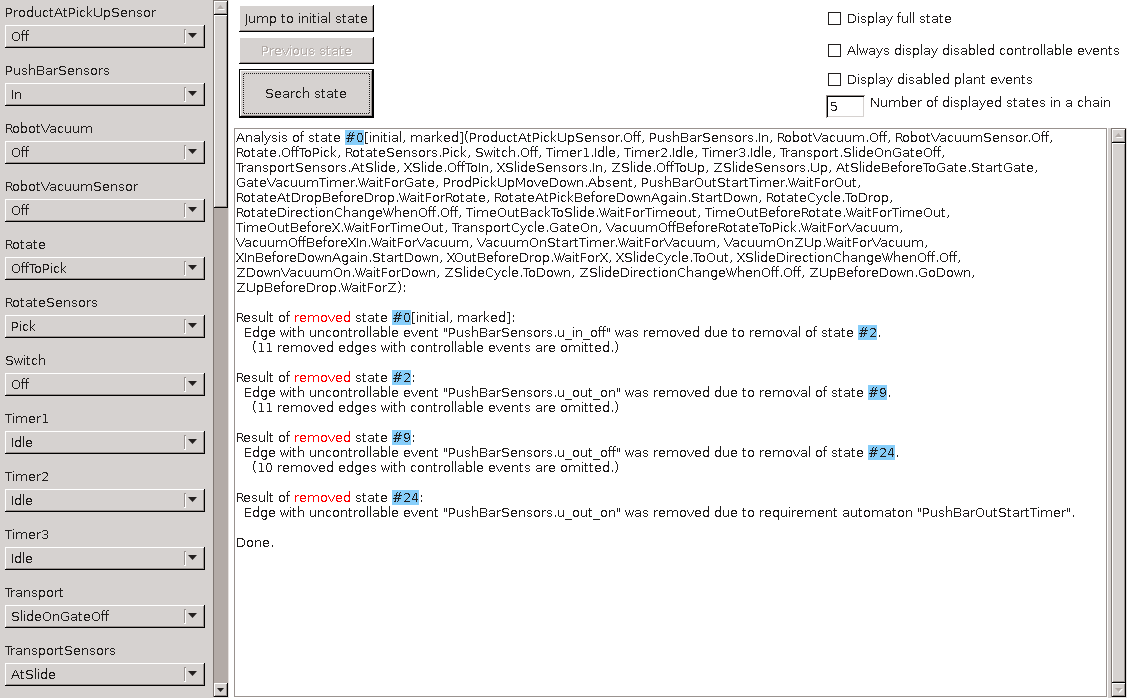
This is an example from a bigger system, where the supervisor is empty. The analysis of the initial state reveals that it was removed due to a removal of a chain of other states. State #24 was removed due to a requirement (reading from bottom to top), which caused the chain of states #9, #2, and eventually #0 to be removed.
Removed edges with controllable events are not displayed here, since these have no influence to the disappearing of the states. If you want, you can display them by toggling the Always display disabled controllable events option at the top-right.
In this example, the number of states in the chain to the disabling requirement was 4 states. This chain can be longer. Usually the middle part is not that interesting and it is omitted from the display, but if you want to see them, you can increase the number of displayed states at the top-right (which is by default 5). Another way to see them is to double-click at a state in the chain, and the analysis tool will display the chain starting from that state.
A situation that is not shown here, is that the analysis tool has no information about a state. It happens when the synthesis encountered a bad state on all paths to that state. In such a case, it displays that there is no information about the queried state.
Starting the synthesis analysis tool
The tool can be started in the following ways:
-
In Eclipse, double-click a
.synth_dumpfile generated by the supervisor synthesis dump. -
In Eclipse, right click a
.synth_dumpfile in the Project Explorer tab or Package Explorer tab and choose Analyze Synthesis Result. -
Use the
cifsynthanalystool in a ToolDef script. See the scripting documentation and tools overview page for details. -
Use the
cifsynthanalyscommand line tool.