State visualizer
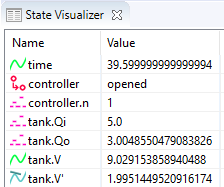
The normal console output, which may include the state of the specification, is printed to the console. The entire state is then printed as a single line of text, which can be hard to read as the specification grows, and the state contains more and more variables. The state visualizer can be used as an alternative. It shows the same information, but in a table in a separate window. Here is an example screenshot of the visualizer:
Unlike the SVG visualizer, which requires that the user makes an image of the system and couples the image to the specification, the state visualizer can be used directly, without any additional effort. All that is required to use it, is to enable it. The state visualizer is disabled by default, and can be enabled using the State visualization option (Output: State visualization category).
Contents
The state visualizer shows all the discrete, input, continuous, and algebraic variables of the specification, as well as their values. It also shows the derivatives of the continuous variables, and their values. This includes variable time, but not its derivative. It also shows the automata, with their current locations. The variables and automata are listed in alphabetical order, except for variable time, which is always shown at the top.
Icons and legend
The icons on the left indicate the kind of object that is shown in a particular row of the table:
-
 An automaton, with its current location.
 -
 A discrete variable, with its current value.
 -
 An input variable, with its current value.
 -
 A continuous variable (includes variable
 time), with its current value. -
 A derivative of a continuous variable (excludes variable
 time), with its current value. -
 An algebraic variable, with its current value.
The values are updated for the initial state, states reached after transitions (event transitions and time transitions), as well as for frames.
Filtering
By default, all state objects are displayed by the state visualizer. Using the State visualization filters option (Output: State visualization category), the state objects can be filtered. The State visualization filters option only has effect if state visualization is enabled, using the State visualization option.
As value for the option, comma separated filters should be supplied. Each filter specifies one or more state objects. The absolute names of the objects are used. That is, for an automaton a, with a variable x, the absolute name of the variable object is a.x. If CIF textual syntax keyword are used as names for events (such as plant), then they must be escaped in .cif files ($plant). For filters however, all escape characters ($) in the names are ignored. The * character can be used as wildcard, to indicate zero or more characters. If a filter doesn’t match any of the state objects of the CIF model, a warning is printed to the console. A warning is also printed if the entire state is filtered out.
By default, filters include matching state objects. Filters may however be preceded by a - character, turning them into exclusion filters, which exclude matching states objects rather than including them. Filters are processed in the order they are specified, allowing for alternating additions and removals. If a filter does not result in the addition/removal of any state objects to/from the filter result, a warning is printed to the console.
As an example, option value a.*,-a.b*,a.bc* consists of three filters: a.*, -a.b*, and a.bc*. The first filter indicates that state objects whose absolute names start with a. are to be included. The second filter indicates that from those matching state objects, the state objects whose absolute names start with a.b* are to be excluded. To that result, the third filter adds those state objects whose absolute names start with a.bc*. For instance, if a specification contains state objects time, a.a, a.b a.bb, a.bc, a.b.c, a.bc, a.bcc, and a.bcd, the result of the three filters is that the following state objects are displayed: a.a, a.bc, a.bc, a.bcc, and a.bcd.
The default option value (filter) is *.
Multiple state visualizers
By default, only one visualizer is shown. However, using the State visualization filters option (Output: State visualization category), it is possible to specify that multiple visualizers should be used. The option allows for filtering of the state objects, as described above. However, such filters can be separated by semicolons, to specify the filters per visualizer.
As an example, consider option value time,a.x;b.y. This results in two state visualizers. The first one displays state objects time and a.x, while the second one displays state object b.y.