Rate example
This example shows:
The use of literal values in output mappings.
How it is best to use simple solutions to solve visualization problems.
SVG image
The following SVG image is used for this example:
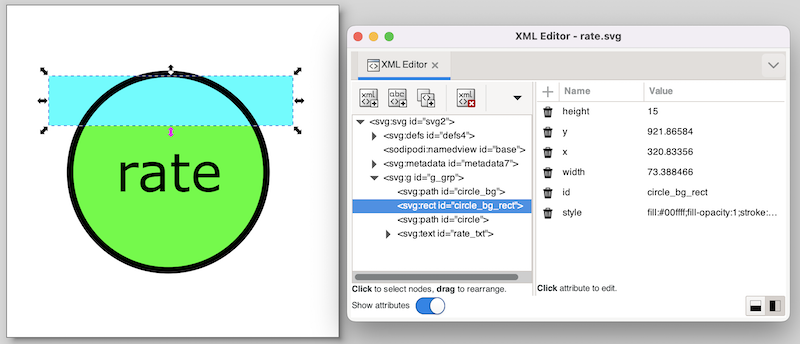
The SVG image visualizes a machine as a circle. The rate of the machine is visualized as the background of the circle. The higher the rate, the more the circle is filled.
Instead of working with complicated clippings or linear gradients, we use a more simple solution here. The black circle has a transparent background (fill attribute set to none). This is the SVG element with id circle. Behind it is the same circle (id circle_bg), but without a border (stroke attribute set to none), and with a green fill color. Between those two circles, is a rectangle (id circle_bg_rect), that at the top is aligned to the top of the circle. By changing the height of the circle, we can now control what part of the green background circle is obscured by the rectangle.
During the actual visualization, we’ll use a white fill color for the rectangle. Since the background is also white, this 'hides' the rectangle, and makes for a partial green background of the circle. Because a white rectangle can not be distinguished from the background, we used a cyan fill color for the rectangle. This makes that we can easily edit the rectangle, and see whether it has the correct initial position, size, etc.
CIF specification
The following CIF specification models the rate example:
// Behavior.
const real MARGIN = 0.01;

automaton machine:
  cont rate der if rate < target_rate:  1.0
                else                   -1.0
                end;
  disc real target_rate = 0.5;
  disc dist real rate_sampler = uniform(0.0, 1.0);

  location:
    initial;
    edge when rate - MARGIN <= target_rate and target_rate <= rate + MARGIN
         do (target_rate, rate_sampler) := sample rate_sampler;
end

// Visualization.
svgfile "rate.svg";

svgout id "circle_bg_rect" attr "height"
  value scale(machine.rate, 0, 1, 58, 0);

svgout id "circle_bg_rect" attr "fill" value "white";
This rather artificial machine has a rate at which it produces. The rate is a value in the interval [0 .. 1]. A target rate (variable target_rate) is randomly chosen in the same interval. The rate is automatically adapted to get closer to the target rate. As soon as the rate is close enough to the target rate, a new target rate is randomly selected, using the rate_sampler, which is a continuous uniform stochastic distribution.
The first mapping controls the height of the rectangle. The value of variable machine.rate has a value in the interval [0 .. 1]. This interval is mapped to the [58 .. 0] pixels interval. That is, if the rate is 0, the height of the rectangle is 58 pixels, and it completely covers the background of the circle. The circle then appears with a completely white background. If the rate is 1, the height of the rectangle is 0, and a completely green background is shown. For rates in between 0 and 1, the lower part of the background of the circle is green, and the upper part is white.
The second mapping sets the fill color of the rectangle to white.
The following image shows an example of the visualization of a partial rate:
